Difference between revisions of "Jan 13, 2020"
| (18 intermediate revisions by the same user not shown) | |||
| Line 11: | Line 11: | ||
== Radial profiles and looking at changes with redshift == | == Radial profiles and looking at changes with redshift == | ||
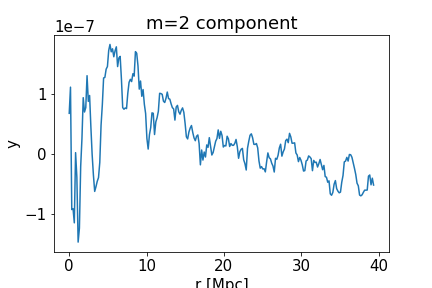
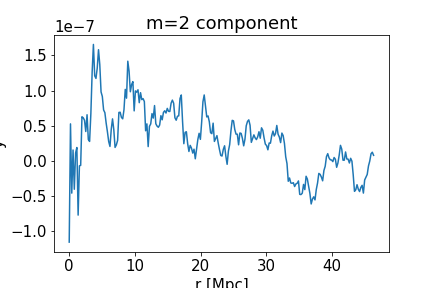
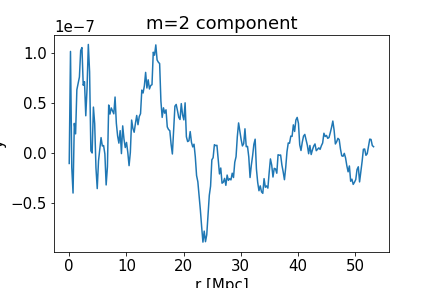
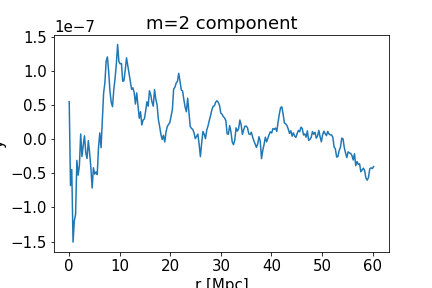
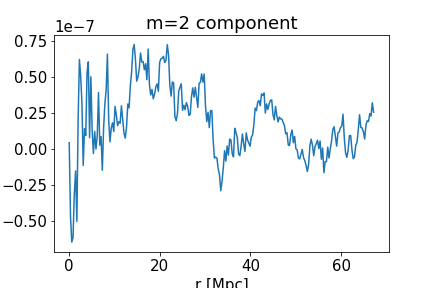
| − | For all the stacks which went into the above combined stack, we can decompose them into multipoles. The variation of the m=2 component with the radial coordinate, when phi=0, is shown below. | + | For all the stacks which went into the above combined stack, we can decompose them into multipoles. The variation of the m=2 component with the radial coordinate, when phi=0, is shown below. These tend to peak 5-10 Mpc away from the center and then drop off further away. The peak values vary, which is probably due mostly to the variation in number of clusters included in each slice. |
[[File:Actplanck rmlambda7to200 HESSIANon54a cmassredmagic 1032to1232Mpc meq2 e0to2on54a 570pts.png | frame|none|alt=Alt text | 1032 to 1232 Mpc, 570 points]] | [[File:Actplanck rmlambda7to200 HESSIANon54a cmassredmagic 1032to1232Mpc meq2 e0to2on54a 570pts.png | frame|none|alt=Alt text | 1032 to 1232 Mpc, 570 points]] | ||
| Line 20: | Line 20: | ||
It would be interesting to make some measure of how the filamentary structure changes with redshift, e.g. in the distance range shown above. I don't know if this is possible given the SNR of the stacks, and I'm not sure about the best way to do this. We would want to compare stacks of the same number of clusters in each redshift slice. Currently, there are ~600 clusters in the 1000-1200 Mpc slice, and that number goes up with each slice to about 1200 in the 1800-2000 Mpc slice. So, say we were interested in the evolution from 2000 Mpc away until 1000 Mpc away (z~.52 to ~.24) we'd need to limit all slices to only 600 clusters per slice. Would probably want to do some random re-sampling of the clusters in each slice to get bootstrap errors. | It would be interesting to make some measure of how the filamentary structure changes with redshift, e.g. in the distance range shown above. I don't know if this is possible given the SNR of the stacks, and I'm not sure about the best way to do this. We would want to compare stacks of the same number of clusters in each redshift slice. Currently, there are ~600 clusters in the 1000-1200 Mpc slice, and that number goes up with each slice to about 1200 in the 1800-2000 Mpc slice. So, say we were interested in the evolution from 2000 Mpc away until 1000 Mpc away (z~.52 to ~.24) we'd need to limit all slices to only 600 clusters per slice. Would probably want to do some random re-sampling of the clusters in each slice to get bootstrap errors. | ||
| + | |||
| + | == Ellipticity parameter == | ||
| + | After a fix with the definition of the ellipticity in COOP, about half of the cluster locations in the number density map have 0 < e < 1. The others are mostly within 1 and 10. There's a note in COOP that on saddle points, e can be > 1, so the clusters for which e>1 must be offset from peaks in the number density map. After some trial and error, I settled on an upper limit of e < 2 because it seems to best enhance the oriented signal. I believe it's cutting out some of the clusters which are in more isolated regions of the map, which is useful. The same result might be better achieved by implementing a cut on the overdensity of the map at that point (as in, only clusters in denser regions would be included; I believe this is called 'nu' in the code). In the stacks shown in this post, I was using 0 < e < 2 and not implementing a lower limit. However, the e parameter should ideally be used for selecting on more elongated regions, which would mean raising the lower limit to something between 0 and 1. I will play around with finding the best value to enhance the oriented signal without eliminating too many clusters. | ||
== Importance of including Redmagic galaxies == | == Importance of including Redmagic galaxies == | ||
| Line 25: | Line 28: | ||
Given Bhuvnesh's warning about how the Redmagic galaxy sample is difficult to mock, we had been wondering if it is possible to do this project with orientations given by the CMASS galaxy field alone. I tested this by making stacks of the same clusters oriented using a number-density field of just the CMASS galaxies, and comparing those with the same stacks when oriented using the CMASS+Redmagic field. An example for the 1600-1800Mpc slice is shown below. White headless vectors show the orientation directions, centered on cluster positions (I haven't plotted the cluster positions themselves, to be able to see the arrows better). | Given Bhuvnesh's warning about how the Redmagic galaxy sample is difficult to mock, we had been wondering if it is possible to do this project with orientations given by the CMASS galaxy field alone. I tested this by making stacks of the same clusters oriented using a number-density field of just the CMASS galaxies, and comparing those with the same stacks when oriented using the CMASS+Redmagic field. An example for the 1600-1800Mpc slice is shown below. White headless vectors show the orientation directions, centered on cluster positions (I haven't plotted the cluster positions themselves, to be able to see the arrows better). | ||
| − | [[File:Galfield compare 1632to1832Mpc rmlambda7to200 ndmap h vectors 25a.png]] | + | [[File:Galfield compare 1632to1832Mpc rmlambda7to200 ndmap h vectors 25a.png | 600px]] |
| + | |||
| + | The inclusion of Redmagic galaxies may not seem to make a major difference based on the above comparison, but when comparing the stacks, it's clear that they are needed. Remaking the combined stack shown as the 5th plot in this post with only CMASS galaxies for orientation yields the following image. | ||
| + | |||
| + | [[File:1032 to 2032 Mpc stacked cmass 17pt8Mpc smth hess 5965cls.png | 400px]] | ||
| + | This is clearly worse than the version which also uses Redmagic galaxies to orient. | ||
| + | |||
| + | == Status update on the mocks == | ||
| + | With the current run of Peak Patch which I've been using, there appears to be too many high-mass halos in comparison with the clusters in RedMaPPer. When limiting the Peak Patch catalog and RedMaPPer catalog to the same region (ACT deep56), for each redshift slice I select all the RedMaPPer clusters with lambda (richness) > 7. I select the same number of the most massive Peak Patch halos in that slice + region. I then convert each cluster's richness to halo mass using the relation in [[https://arxiv.org/pdf/1805.00039.pdf]] ("Dark Energy Survey Year 1 results: weak lensing mass calibration of redMaPPer galaxy clusters" McClinctock et al. 2019). Comparing the samples in every redshift slice always shows the Peak Patch halos at higher masses, e.g. the below graph (y-axis is shared): | ||
| + | |||
| + | [[File:Mass comparison pp rm cls 1432 1632.png | 600 px]] | ||
| + | |||
| + | This is probably attributable to the higher value of sigma-8 in the Planck CMB results than DES. This run of Peak Patch was done with Planck cosmological parameters, so I should do another run of the simulation with the DES value of sigma 8 to see how the samples compare. | ||
| − | + | After the new simulation run is done, I'll dive into mocking Redmagic galaxies with Peak Patch. I plan to do that with the HOD rather than just with approximate halo mass matching as I was doing previously for CMASS. | |
Latest revision as of 22:40, 13 January 2020
Combining stacks of different redshifts
I've written a program to take the stacks of clusters in different 200Mpc slices, resize them all to the same physical size, and stack them. Below are plots showing the stack from one slice, then adding the stacks from each successively more distant slice. This combination helps to bring out the signal. These were all done using the combined CMASS and Redmagic galaxy maps for orientation, at an ~18 Mpc smoothing scale, with the ellipticity 0 < e < 2 (more written on the ellipticity later). In order, left to right and up to down, the images below start at the 1000-1200 Mpc slice, then add and average the successive 200 Mpc stacks until the final image is the average of 5 stacks in the 1000-2000 Mpc range.
Radial profiles and looking at changes with redshift
For all the stacks which went into the above combined stack, we can decompose them into multipoles. The variation of the m=2 component with the radial coordinate, when phi=0, is shown below. These tend to peak 5-10 Mpc away from the center and then drop off further away. The peak values vary, which is probably due mostly to the variation in number of clusters included in each slice.
It would be interesting to make some measure of how the filamentary structure changes with redshift, e.g. in the distance range shown above. I don't know if this is possible given the SNR of the stacks, and I'm not sure about the best way to do this. We would want to compare stacks of the same number of clusters in each redshift slice. Currently, there are ~600 clusters in the 1000-1200 Mpc slice, and that number goes up with each slice to about 1200 in the 1800-2000 Mpc slice. So, say we were interested in the evolution from 2000 Mpc away until 1000 Mpc away (z~.52 to ~.24) we'd need to limit all slices to only 600 clusters per slice. Would probably want to do some random re-sampling of the clusters in each slice to get bootstrap errors.
Ellipticity parameter
After a fix with the definition of the ellipticity in COOP, about half of the cluster locations in the number density map have 0 < e < 1. The others are mostly within 1 and 10. There's a note in COOP that on saddle points, e can be > 1, so the clusters for which e>1 must be offset from peaks in the number density map. After some trial and error, I settled on an upper limit of e < 2 because it seems to best enhance the oriented signal. I believe it's cutting out some of the clusters which are in more isolated regions of the map, which is useful. The same result might be better achieved by implementing a cut on the overdensity of the map at that point (as in, only clusters in denser regions would be included; I believe this is called 'nu' in the code). In the stacks shown in this post, I was using 0 < e < 2 and not implementing a lower limit. However, the e parameter should ideally be used for selecting on more elongated regions, which would mean raising the lower limit to something between 0 and 1. I will play around with finding the best value to enhance the oriented signal without eliminating too many clusters.
Importance of including Redmagic galaxies
Given Bhuvnesh's warning about how the Redmagic galaxy sample is difficult to mock, we had been wondering if it is possible to do this project with orientations given by the CMASS galaxy field alone. I tested this by making stacks of the same clusters oriented using a number-density field of just the CMASS galaxies, and comparing those with the same stacks when oriented using the CMASS+Redmagic field. An example for the 1600-1800Mpc slice is shown below. White headless vectors show the orientation directions, centered on cluster positions (I haven't plotted the cluster positions themselves, to be able to see the arrows better).
The inclusion of Redmagic galaxies may not seem to make a major difference based on the above comparison, but when comparing the stacks, it's clear that they are needed. Remaking the combined stack shown as the 5th plot in this post with only CMASS galaxies for orientation yields the following image.
 This is clearly worse than the version which also uses Redmagic galaxies to orient.
Status update on the mocks
With the current run of Peak Patch which I've been using, there appears to be too many high-mass halos in comparison with the clusters in RedMaPPer. When limiting the Peak Patch catalog and RedMaPPer catalog to the same region (ACT deep56), for each redshift slice I select all the RedMaPPer clusters with lambda (richness) > 7. I select the same number of the most massive Peak Patch halos in that slice + region. I then convert each cluster's richness to halo mass using the relation in [[1]] ("Dark Energy Survey Year 1 results: weak lensing mass calibration of redMaPPer galaxy clusters" McClinctock et al. 2019). Comparing the samples in every redshift slice always shows the Peak Patch halos at higher masses, e.g. the below graph (y-axis is shared):
This is probably attributable to the higher value of sigma-8 in the Planck CMB results than DES. This run of Peak Patch was done with Planck cosmological parameters, so I should do another run of the simulation with the DES value of sigma 8 to see how the samples compare.
After the new simulation run is done, I'll dive into mocking Redmagic galaxies with Peak Patch. I plan to do that with the HOD rather than just with approximate halo mass matching as I was doing previously for CMASS.


