Difference between revisions of "November 26th, 2018"
| (One intermediate revision by the same user not shown) | |||
| Line 4: | Line 4: | ||
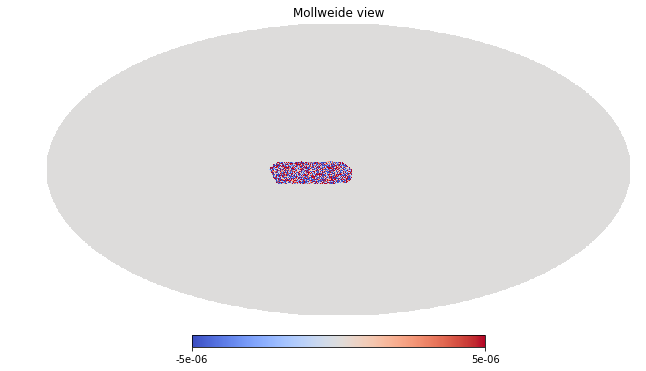
[[File:ACT_ymap_hp.png|frame|none|alt=Alt text|The ACT preliminary y-map in Healpix format. This sphere corresponds with RA and Declination such that Dec = 0 is along the equator.]] | [[File:ACT_ymap_hp.png|frame|none|alt=Alt text|The ACT preliminary y-map in Healpix format. This sphere corresponds with RA and Declination such that Dec = 0 is along the equator.]] | ||
| + | |||
| + | [[File:ACT_ymap_coverage.png|frame|none|alt=Alt text|The original (flat) ACT y-map in Right Ascension, Declination.]] | ||
| + | |||
| + | [[File:DES_Cluster_coverage.png|frame|none|alt=Alt text|The DES cluster coverage of Y3 in the ACT y-map range of RA and Dec.]] | ||
| + | |||
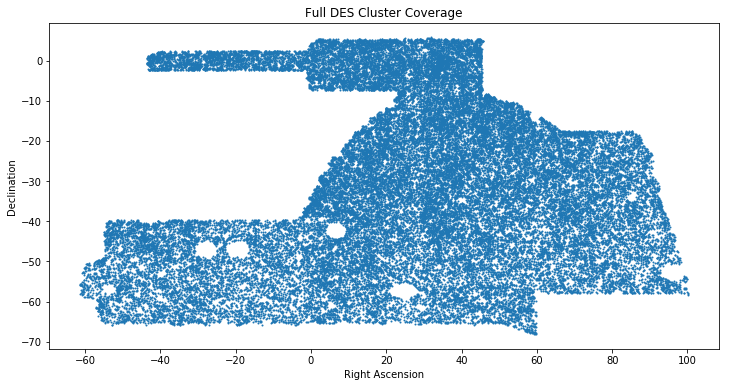
| + | [[File:Full_DES_Cluster_Coverage.png|frame|none|alt=Alt text|The full locations of DES Y3 RedMapper clusters.]] | ||
== Planck y-map stacked on RedMaPPer Cluster Catalog == | == Planck y-map stacked on RedMaPPer Cluster Catalog == | ||
| Line 14: | Line 20: | ||
[[File:bevington_planck_rm_random_stack.png|500px|Alt]] | [[File:bevington_planck_rm_random_stack.png|500px|Alt]] | ||
| − | |||
| − | |||
As a sanity check for my (theta, phi) conversions, I wanted to ensure that this output was different from what it would be if I stacked on random (theta, phi) values. So I shifted each (theta, phi) by some amount and stacked on those points. This does come out completely random as expected: | As a sanity check for my (theta, phi) conversions, I wanted to ensure that this output was different from what it would be if I stacked on random (theta, phi) values. So I shifted each (theta, phi) by some amount and stacked on those points. This does come out completely random as expected: | ||
Latest revision as of 15:41, 10 December 2018
Converting the ACT y-map to Healpix format
The preliminary y-map made by Colin Hill (link here ) is provided in a plate carrée / CAR projection of the the spherical data. To convert this to the spherical system HealPix (used by Planck), I use the the Python library enlib. The function enmap.to_healpix converts a flat map to a Healpix one in RING order. I am currently converting to a map with NSIDE=4096. This corresponds to ~.43 arcminutes per pixel. The arcminutes/pixel of the y-map in its original form was 0.5, so the Healpix map has slightly smaller pixels in comparison. If this is a problem, I can easily change it.
Planck y-map stacked on RedMaPPer Cluster Catalog
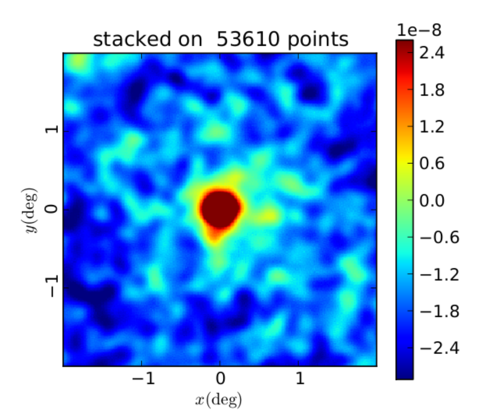
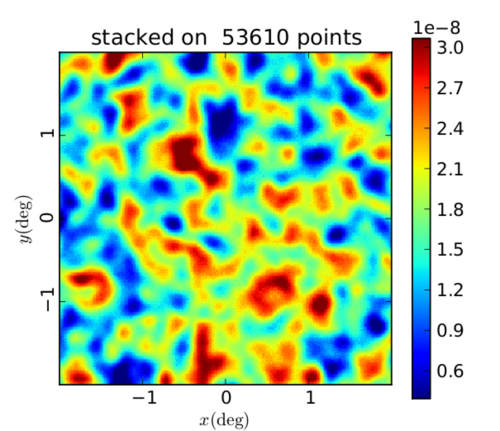
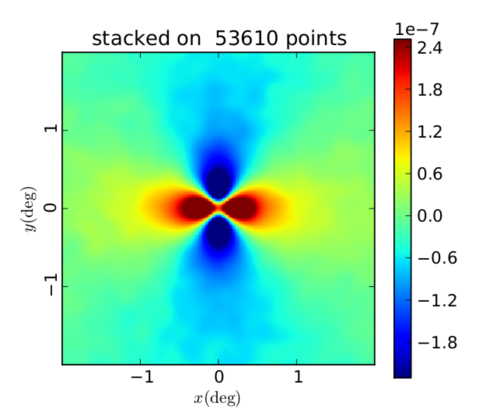
In the following plots, I am using the catalog described on the website as "Y3A2 Gold 2.2.1 sof colors, redMaPPer v6.4.22+2, Full, lambda>20." There are 53,610 clusters in this catalog. I start by taking the first RA and Dec given for each cluster (defined as the "most likely center" of the cluster). Then, since the Planck maps are Healpix maps with Galactic coordinates, I convert (RA, Dec) to (l,b) using Astropy. Next, I convert (l, b) to Healpix (theta, phi) values assuming that b=0 corresponds with theta=90 degrees and that l = phi (and then theta, phi should be in radians). This is the (theta, phi) list I am inputting to COOP to identify the cluster locations on the Planck y-map.
Random orientation, map FWHM 10'
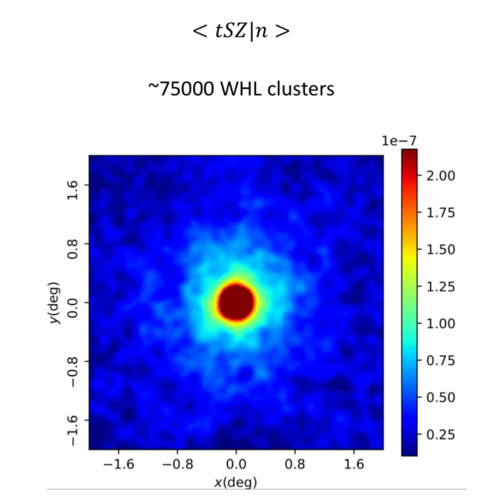
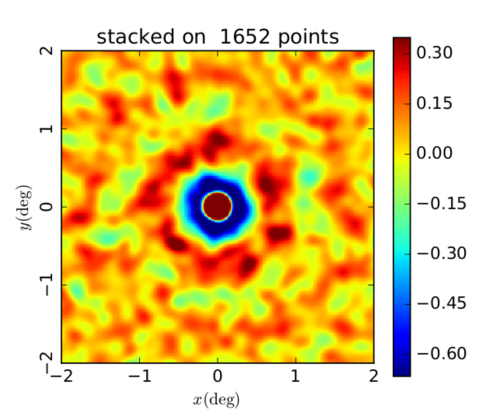
This can be compared with Connor Bevington's stack on WHL clusters:
As a sanity check for my (theta, phi) conversions, I wanted to ensure that this output was different from what it would be if I stacked on random (theta, phi) values. So I shifted each (theta, phi) by some amount and stacked on those points. This does come out completely random as expected:
QU orientation, map FWHM 10'
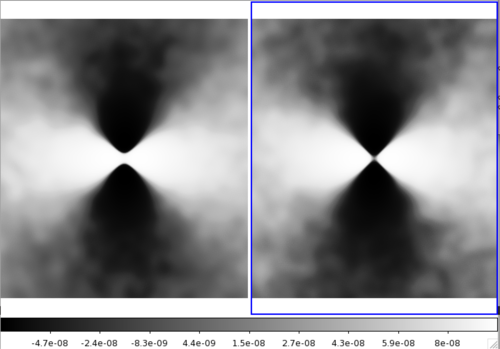
I was suspicious of this stack because it didn't seem to be centered on clusters, so I also did a stack on random points in the map and compared them side-by-side. The difference was only noticeable when scaling the colorbar in a certain way (here I am using SAO DS9 and scaling by "histogram"):
The results of stacking on cluster theta, phi values are on the left and random points are on the right.
Since using the oriented method on random points intrinsically results in an oriented stack, even though that doesn't represent real structure, I am wondering if when we do analysis on the oriented stack we need to subtract an oriented stack from random points. (i.e. Would we subtract the right from the left and analyse the residual?)
ACT y-map stacked on peaks within the map
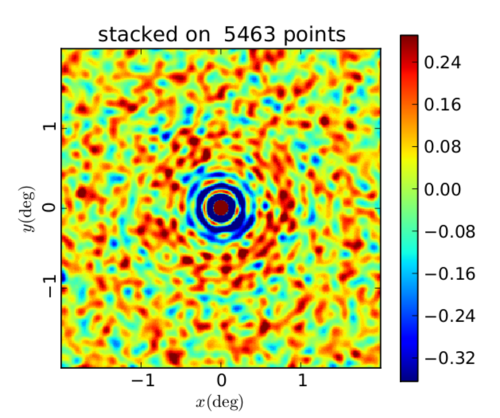
Random orientation, peaks found at 1.4' scale
Random orientation, peaks found at 10' scale
Here, the map is also smoothed to 10'.
I'm still not sure why the map scaling is so off but I again think it has to do with masking. It seems like some of the components of the stack have very different values than the others and this is throwing off the average / the scaling. The next step for me to fix this issue is to update the very simple mask I made initially to remove extreme pixels.
