Difference between revisions of "Sep 26, 2018 - Excercise1"
Jump to navigation
Jump to search
| (One intermediate revision by the same user not shown) | |||
| Line 7: | Line 7: | ||
(ex. wget https://mocks.cita.utoronto.ca/data/lensing/cmb_temperature_lensed.fits) | (ex. wget https://mocks.cita.utoronto.ca/data/lensing/cmb_temperature_lensed.fits) | ||
| − | 2. | + | 2. Lens CMB to get a CMB lensed map |
Used the command listed in | Used the command listed in | ||
| Line 22: | Line 22: | ||
(log) | (log) | ||
'''Kappa map''' | '''Kappa map''' | ||
| − | |||
[[File:Kappa.png|250x250px|view of a patch from 5º~10ºN, 5º~10ºE]] | [[File:Kappa.png|250x250px|view of a patch from 5º~10ºN, 5º~10ºE]] | ||
view of a patch from 5º~10ºN, | view of a patch from 5º~10ºN, | ||
Latest revision as of 04:08, 27 September 2018
This is an exercise George and Pavel gave me to get an idea of working with lenspix and healpy.
1. Get CMB unlensed + kappa map from mocks.cita.utoronto.ca
  Used the 'wget' command
  (ex. wget https://mocks.cita.utoronto.ca/data/lensing/cmb_temperature_lensed.fits)
2. Lens CMB to get a CMB lensed map
  Used the command listed in
  (python lens.py ../cmb_temperature_unlensed.fits ../cmb_temperature_unlensed_alm.fits ../p_180921.fits
  ../cmb_temperature_lensed.fits -np 8)
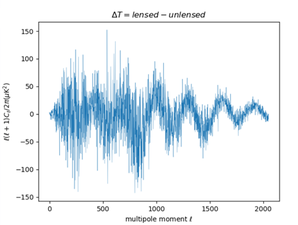
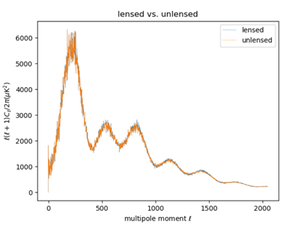
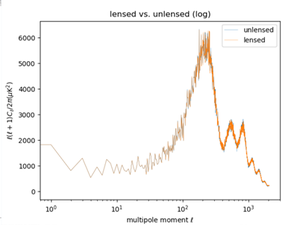
3. Plot CMB unlensed + cmb lensed with unit labels, also ΔT = lens-unlensed, also zoom in on 5º, 10º patch on Kappa map.
Used 'healpy', 'anafast', 'matplotlib.pyplot' etc.

                                                                   (log)
   Kappa map

      view of a patch from 5º~10ºN,
      5º~10ºE using 'cartview'
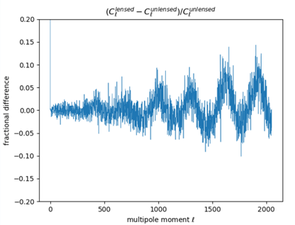
4. Take the power spectrum of CMB lensed and unlensed; plot this, and plot the fractional difference of the spectrums.

(log)

