Difference between revisions of "Nov 3, 2019"
| Line 8: | Line 8: | ||
== Data Stacks == | == Data Stacks == | ||
| − | The following plots are various versions of stacks on cluster locations in the number density map with different versions of orientation on various smoothing scales. Some also have eccentricity cuts. | + | The following plots are various versions of stacks on cluster locations in the number density map with different versions of orientation on various smoothing scales. Some also have eccentricity cuts. Warning: the axes are not scaled the same, because most of these stacks contain different numbers of clusters and so it makes more sense to look at the comparative intensity of the 'bowtie' vs the center than to scale all axes the same. |
These are all done for the 1600-1800 Mpc slice. | These are all done for the 1600-1800 Mpc slice. | ||
Latest revision as of 22:34, 20 November 2019
Data Updates
I am now incorporating the DES redMaGiC galaxy catalogue of luminous red galaxies. The number density maps will be made up of CMASS and redMaGiC galaxies. Figure 1 shows a ~200 Mpc slice at z~.55 with CMASS galaxies plotted in blue and redMaGiC in gray. The redMaPPer clusters which will be stacked are plotted in larger red circles. As expected, the clusters trace the redMaGiC galaxy distribution because the two samples are run with the same algorithm.
I also got the ACT SZ cluster catalog from Mat, so that I can incorporate clusters in the BOSS region. I need to learn more about this catalog, since many of the clusters have redshifts given for them but I don't know this is done with SZ / how the errors work.
Data Stacks
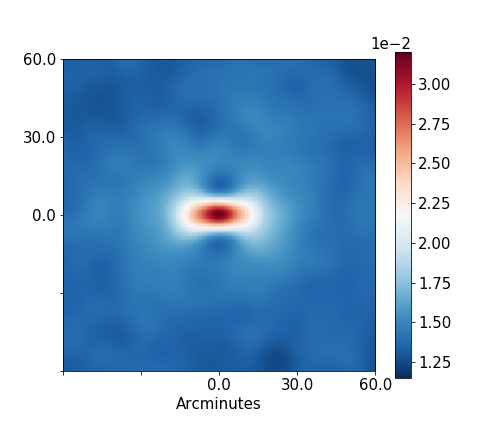
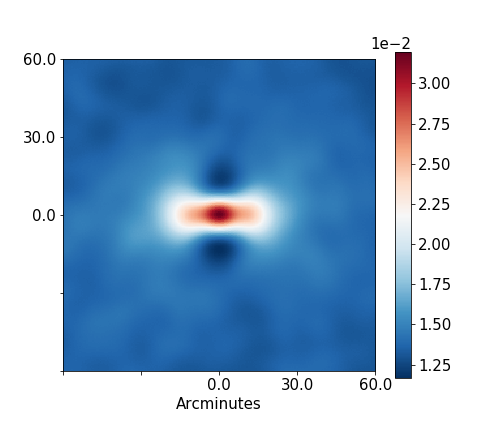
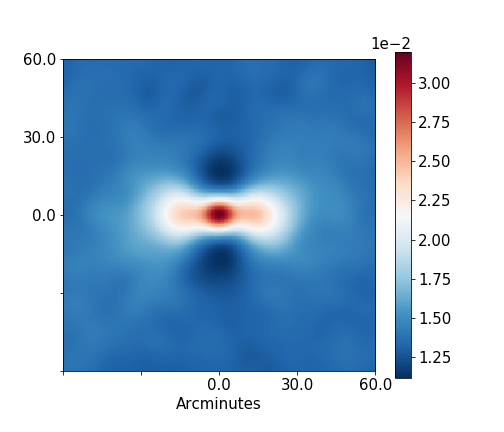
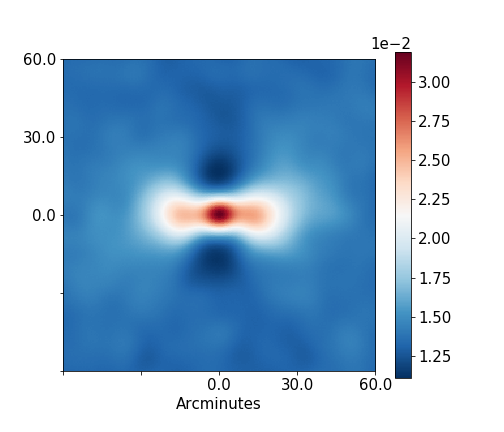
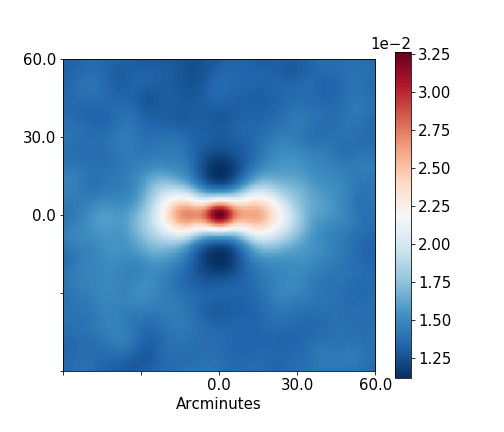
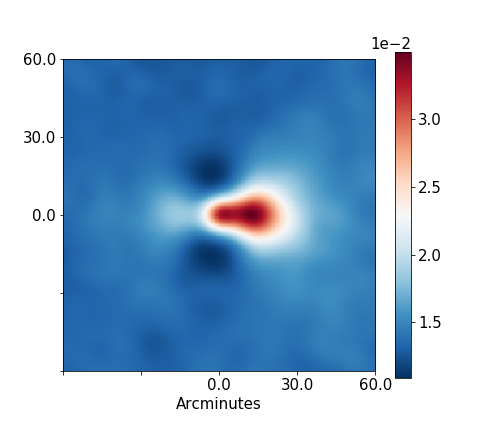
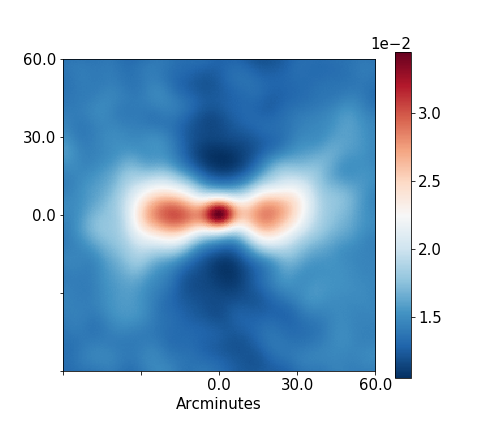
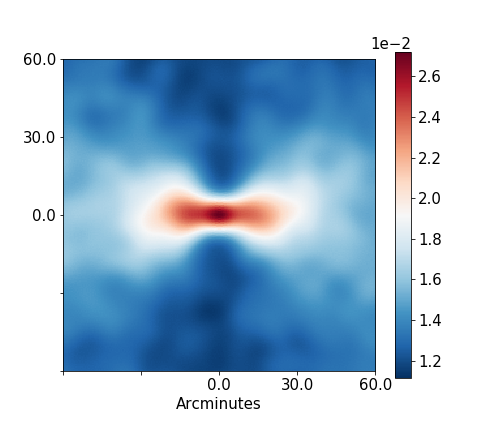
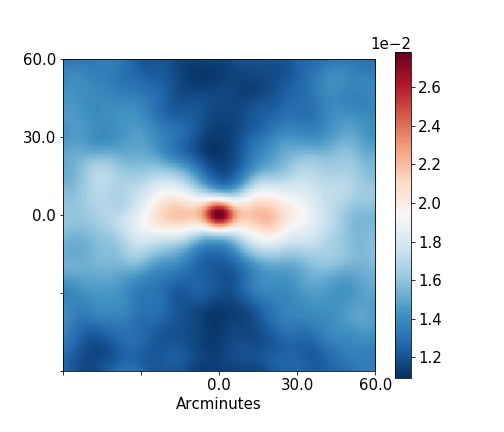
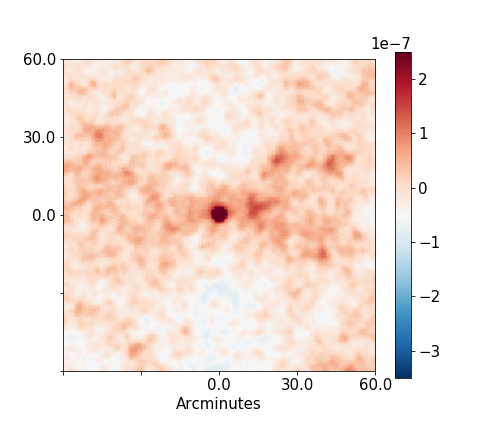
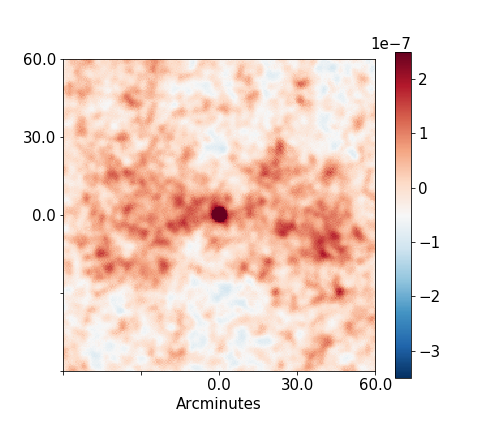
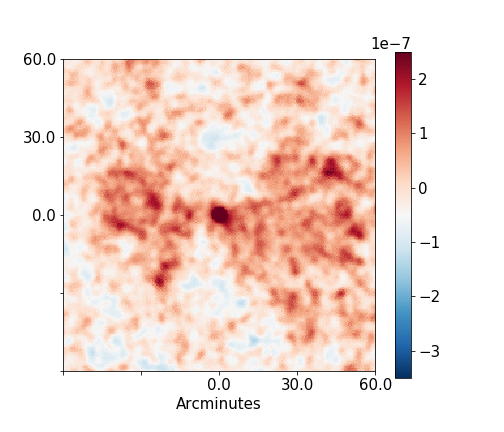
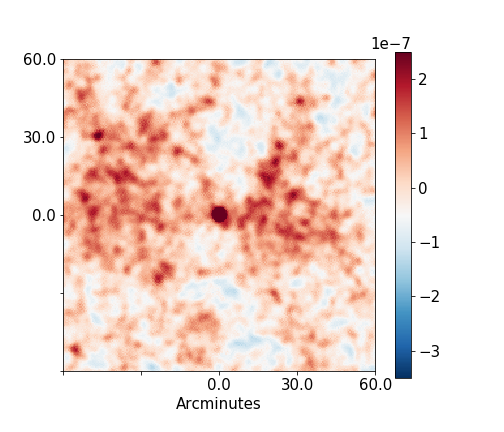
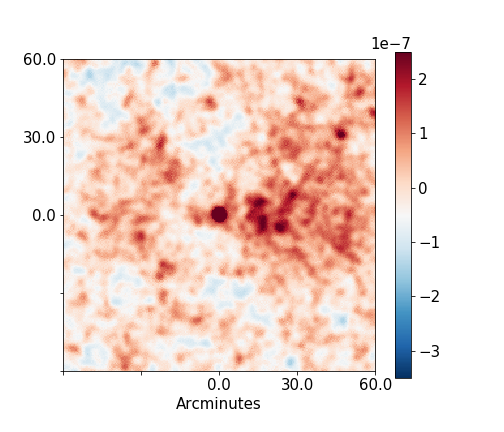
The following plots are various versions of stacks on cluster locations in the number density map with different versions of orientation on various smoothing scales. Some also have eccentricity cuts. Warning: the axes are not scaled the same, because most of these stacks contain different numbers of clusters and so it makes more sense to look at the comparative intensity of the 'bowtie' vs the center than to scale all axes the same.
These are all done for the 1600-1800 Mpc slice. "a" means arcminutes in all of the captions.
Sims
Trying eccentricity cuts. Start with lambda > 10 clusters (from Redmapper lambda-halo mass relation), 200 Mpc slice ~ z=0.55. Hessian orientation on 30 arcminutes of the full number density map from Peak Patch.

