Difference between revisions of "Jan 13, 2020"
| Line 13: | Line 13: | ||
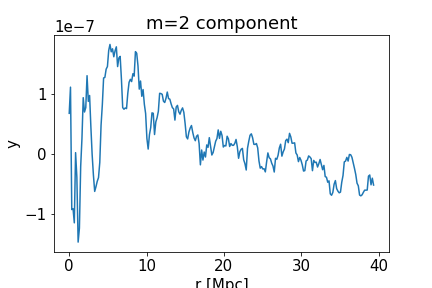
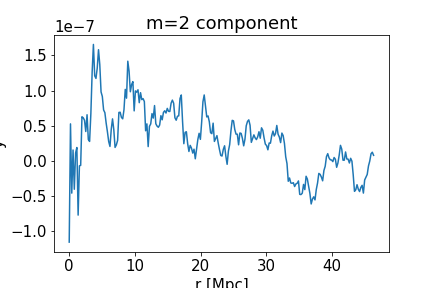
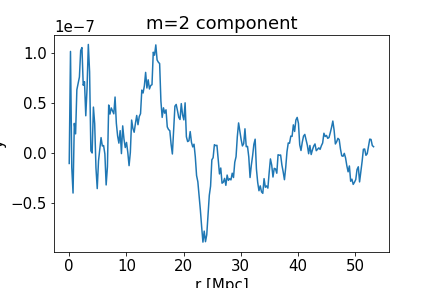
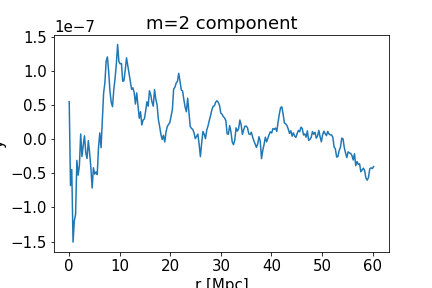
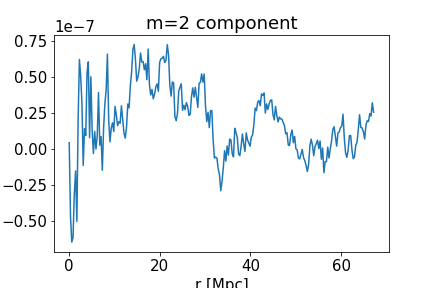
The radial profiles of the m=2 component of all the stacks which went into the above stack are shown below. | The radial profiles of the m=2 component of all the stacks which went into the above stack are shown below. | ||
| − | [[File:Actplanck rmlambda7to200 HESSIANon54a cmassredmagic 1032to1232Mpc meq2 e0to2on54a 570pts.png | + | [[File:Actplanck rmlambda7to200 HESSIANon54a cmassredmagic 1032to1232Mpc meq2 e0to2on54a 570pts.png | frame|none|alt=Alt text | 1032 to 1232 Mpc, 570 points]] |
[[File:Actplanck rmlambda7to200 HESSIANon46a cmassredmagic 1232to1432Mpc meq2 e0to2on46a 579pts.png | frame|none|alt=Alt text | 1232 to 1432 Mpc, 579 points]] | [[File:Actplanck rmlambda7to200 HESSIANon46a cmassredmagic 1232to1432Mpc meq2 e0to2on46a 579pts.png | frame|none|alt=Alt text | 1232 to 1432 Mpc, 579 points]] | ||
[[File:Actplanck rmlambda7to200 HESSIANon40a cmassredmagic 1432to1632Mpc meq2 e0to2on40a 851pts.png | frame|none|alt=Alt text | 1432 to 1632 Mpc, 851 points ]] | [[File:Actplanck rmlambda7to200 HESSIANon40a cmassredmagic 1432to1632Mpc meq2 e0to2on40a 851pts.png | frame|none|alt=Alt text | 1432 to 1632 Mpc, 851 points ]] | ||
Revision as of 05:46, 13 January 2020
Combining stacks of different redshifts
I've written a program to take the stacks of clusters in different 200Mpc slices, resize them all to the same physical size, and stack them. Below are plots showing the stack from one slice, then adding the stacks from each successively more distant slice. This combination helps to bring out the signal. These were all done using the combined CMASS and Redmagic galaxy maps for orientation, at an ~18 Mpc smoothing scale, with the ellipticity 0 < e < 2 (more written on the ellipticity later). In order, left to right and up to down, the images below start at the 1000-1200 Mpc slice, then add and average the successive 200 Mpc stacks until the final image is the average of 5 stacks in the 1000-2000 Mpc range.
Radial profiles and looking at changes with redshift
The radial profiles of the m=2 component of all the stacks which went into the above stack are shown below.
It would be interesting to make some measure of how the filamentary structure changes with redshift, e.g. in the distance range quoted above. I don't know if this is possible given the SNR of the stacks, and I'm not sure about the best way to do this. We would want to compare stacks of the same number of clusters in each redshift slice. Currently, there are ~600 clusters in the 1000-1200 Mpc slice, and that number goes up with each slice to about 1200 in the 1800-2000 Mpc slice. We'd have to limit all slices to the lower numbers, i.e. ~600 per stack. Could just choose the right number randomly out of the ones currently being used, but given the relatively
Importance of including Redmagic galaxies
Given Bhuvnesh's warning about how the Redmagic galaxy sample is difficult to mock, we had been wondering if it is possible to do this project with orientations given by the CMASS galaxy field alone. So, I tested stacks at various smoothing scales


