October 1st, 2018
Code Details and Software Installation
Connor Bevington's GitHub repository is here: [1] This repository contains .ini files for input to the Cosmology Object Oriented Package (COOP): [2] I have installed COOP in my CITA computing account. COOP requires several other packages to run; many of the most recent versions of these packages were incompatible with COOP. The versions that have worked for me are:
- Healpix V3.31
- gcc/5.4.0
- openmpi/2.0.0-gcc-5.4.0
- gsl/2.2.1-gcc-5.4.0
- cfitsio/3.390
All of the above can be loaded as modules on the CITA system except for Healpix, which can be downloaded from here: [3].
The basic structure to run the stacking codes is to first run a program to find peaks, and then run a second program to stack on those peaks. These programs are run in COOP/mapio. For example, this might look like:
./GetPeaks planck_tt_max_random.ini
./Stack planck_tt_max_random_stack.ini
Naming conventions for the files are found on Connor's GitHub READMEs. "GetPeaks" produces a list of points to stack on, depending what the .ini file defines as a peak. "Stack" does the actual stacking and produces a .txt file that can be converted to a .pdf image by the following (ran in COOP/mapio):
python ../utils/pypl.py myfigure.txt myfigure.pdf
This did not work with me when the COOP required modules were loaded, but I had success after unloading the current gcc and Python and instead loading:
- gcc/7.3.0
- Python 2.7.3
The images displayed below are from this pre-made COOP plotting function. "Stack" also produces a FITS file that can be manually plotted or loaded in saods9, instead of using the previous command.
Maps
<tSZ | tSZ>
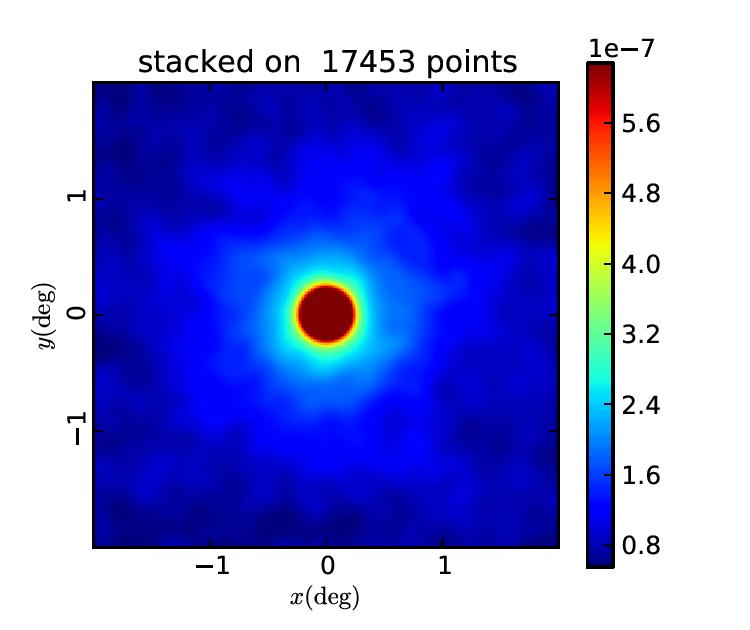
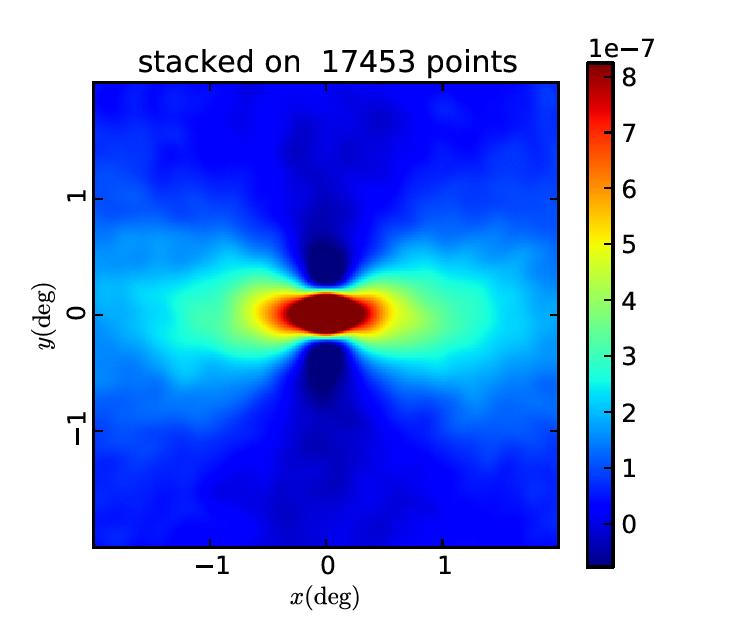
Peaks in Planck tSZ map stacked onto each other
Random orientation, peak finding on 10’, map presmoothed to 10’:
QU orientation, peak finding on 10’, map presmoothed to 10’:
These two runs each found ~17,000 peaks, whereas Connor's final SURP presentation slides show that his runs with the same data and smoothing found about 40,000 peaks. I am unsure whether he perhaps used an older or otherwise different Planck y-map, or if something in my run is actually causing it to find fewer peaks. The granularity also looks different than in Connor's plots, but this may be due to a different colorbar scale, so I will try adjusting that next.

