Feb 14, 2019 - Filtering of Unlensed, Poisson, and Gaussian maps
Here are some follow up analysis I did. I generated a Gaussian map and ran it through top hat filters and our original band filters and compared the maps/results with the Poisson and sims-unlensed total maps.
The Gaussian map was generated using 'numpy.random.normal' inputting the same mean and standard deviation as the sims-unlensed total map. For the Poisson map, the reason I used the scaling factor (800) was to have a map that has the same mean and variance as the sims-map.
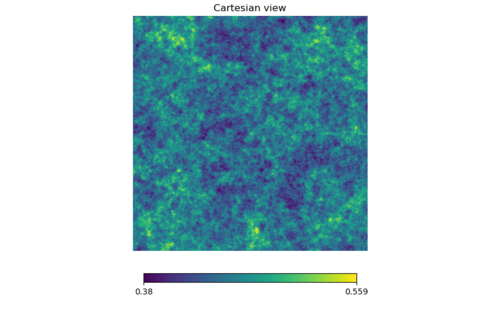
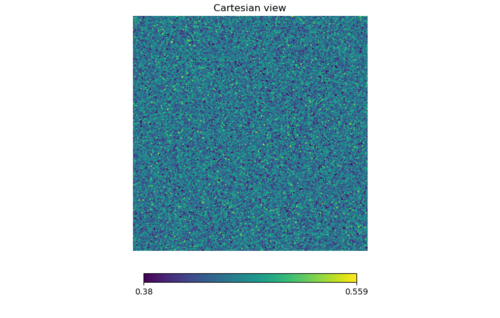
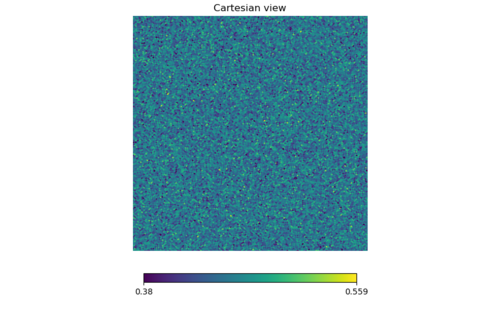
1. 5 by 5 degree maps using 'cartview.' The order is 'sims', 'Poisson', 'Gaussian.'
It turns out the Poisson and Gaussian maps are quite similar (at least by eye).
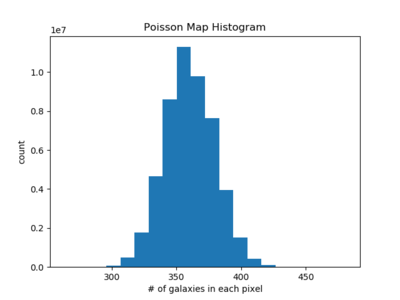
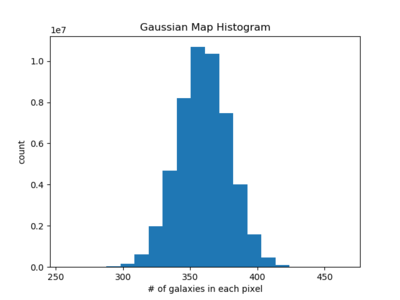
2. Histogram of the three maps after multiplying by 800 with 20 bins. Again, the order is 'sims', 'Poisson', 'Gaussian.'
The three histograms are certainly different from one another, but the Poisson's and Gaussian's are quite similar other than the two highest bars.
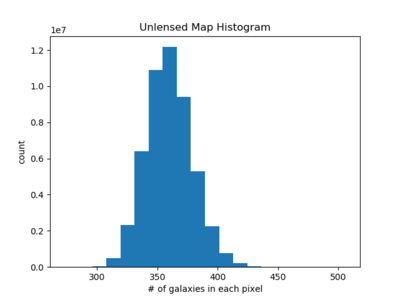
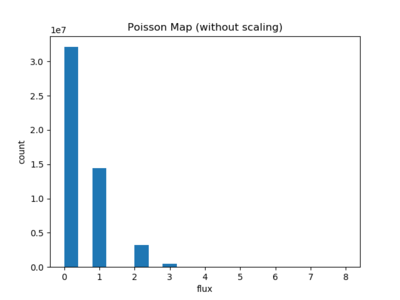
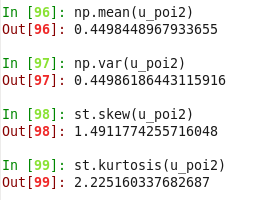
3. Histogram and basic statistics of a Poisson map defined without the scaling factor (with the mean as simply np.mean(sims-unlensed)).
Although the mean is the same as the sims-map, the variance is huge (compared to sims-map, below), which is why I believe there is little meaning in analysing this map.
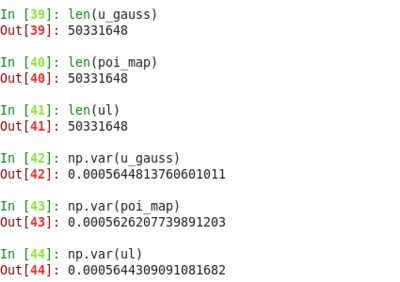
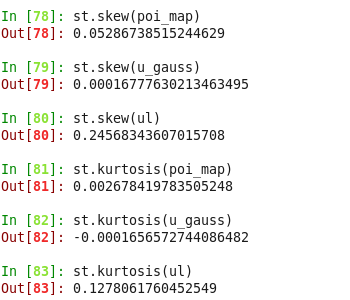
4. Variance, skewness and kurtosis of the three maps. U_gauss: Gaussian map, poi_map = Poisson map, and ul = sims map (I apologize if it is hard to read.)
The variances were set to be almost the same, the skewness of the Poisson map is much larger than the Gaussian, while the difference is not as pronounced for the kurtosis. The total skewness and kurtosis seem to have some relation to the filtered ones (below).
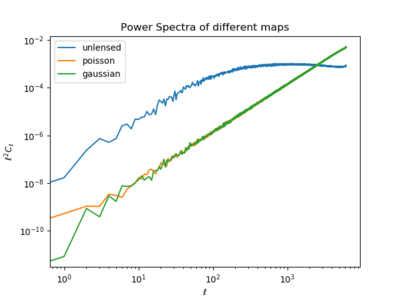
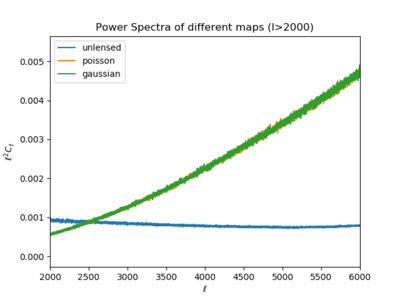
5. Power spectra of the three maps. 'Unlensed' = sims map
The power spectra of both the Poisson and Gaussian rise almost linearly with ell when ell > 2000. However, the power spectrum of the sims map does not follow a similar trend to the Poisson and Gaussian even at high ell. Also, the power spectra of the Poisson and Gaussian maps are almost the same.
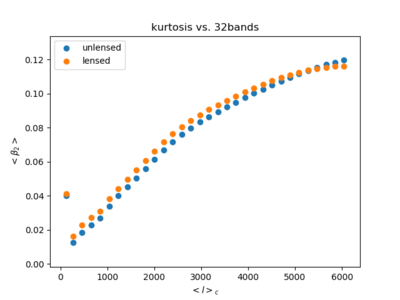
6. Top hat filtered skewness and kurtosis of the three maps. Again, the order is 'sims', 'Poisson', 'Gaussian'.
Skewness
The skewness by lbands all follow a similar trend (to each other) with top hat filters. The skewness of the sims-map is much larger than the other maps at low ell. But at high ell (where the sims-map should follow Poisson statistics), the skewness is virtually zero for all three maps. There is a difference between the Poisson and Gaussian maps although small (at low ell), which matches the difference between the skewness of the total (not by band) maps.
Kurtosis
The kurtosis also follow similar trends with each other, but the Poisson's and Gaussian's are virtually the same. This reflects the smaller kurtosis difference between the total Poisson and Gaussian maps, and also the fact that the kurtosis values for the total maps were much smaller compared to the sims-map. The sims-map's kurtosis rises more than the other maps, but not by much.
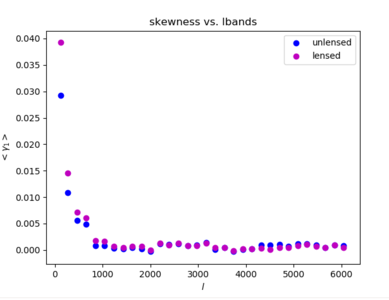
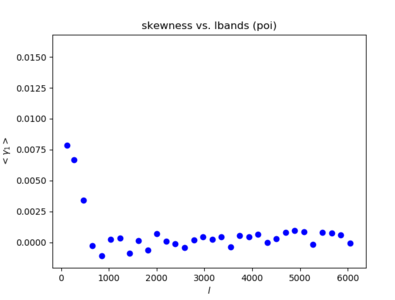
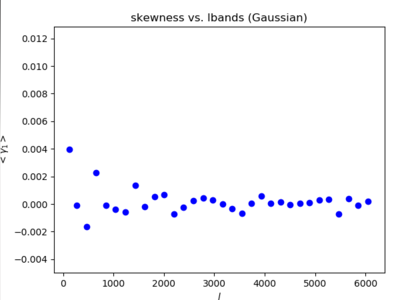
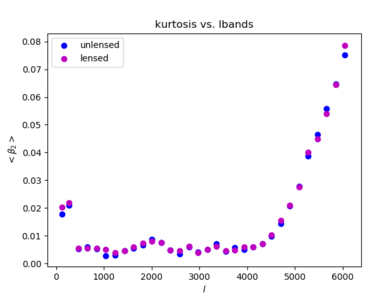
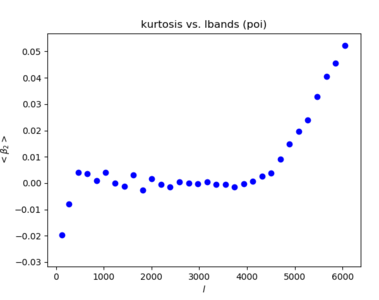
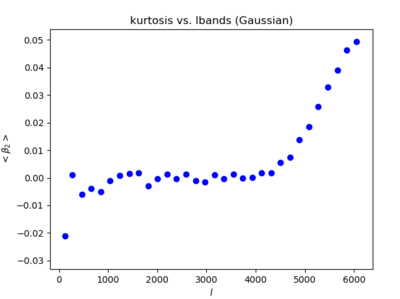
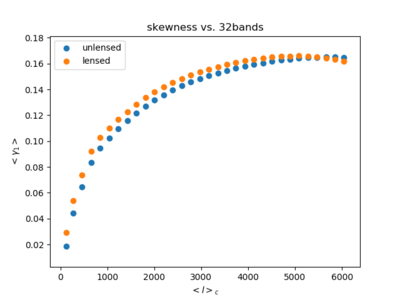
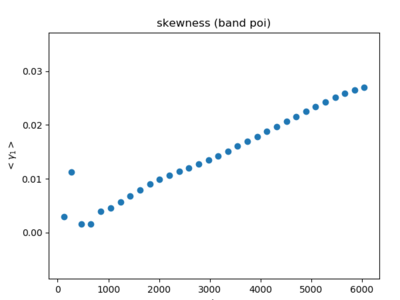
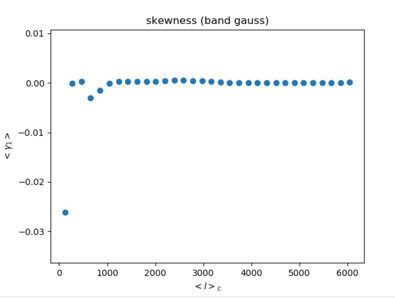
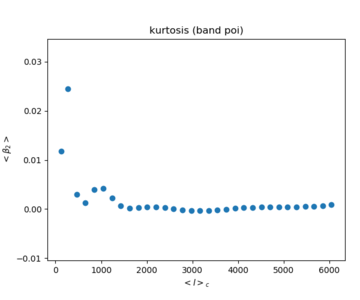
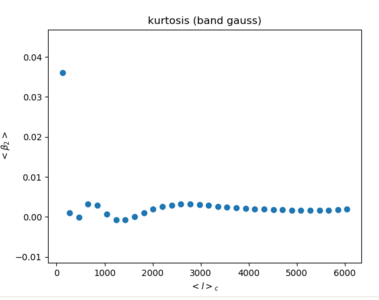
7. Our original band filtered and kurtosis of the three maps.
Skewness
The skewness by lbands of the three maps have different trends. The Poisson and Gaussian skewness do differ, although not by much.
Kurtosis
The kurtosis by lbands are different for the sims-map compared to the Gaussian and Poisson. But the Gaussian and Poisson show almost identical results.
Conclusion
The Poisson map I generated seem quite Gaussian. Perhaps I should try defining it in another way. It is also odd that the Poisson and sims-map power spectra do not have similar trends at high ell.
The skewness and kurtosis by lbands from top-hat filtering do not show very different results even between the Gaussian and sims-map, meaning that the non-Gaussianity cannot be detected well within similar size structures, and the kurtosis rises with ell even for the Gaussian map for some reason.
However, the prospect of detecting non-Gaussianity seems more promising for our original band filtering. The skewness and kurtosis for the Gaussian map are virtually zero (except for an outlier at low ell) as expected, while they certainly rise with ell for the sims-map.
