Feb 20, 2019 - Comparison of Skewness & Kurtosis between sims and Gaussian maps (edited)
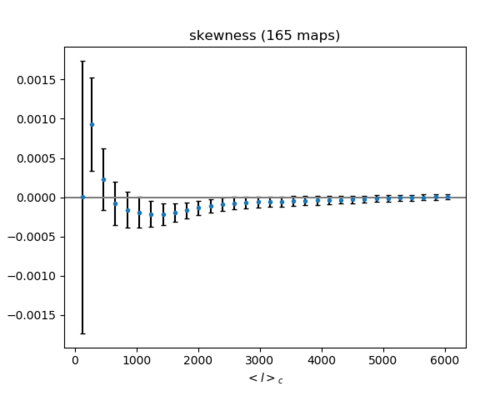
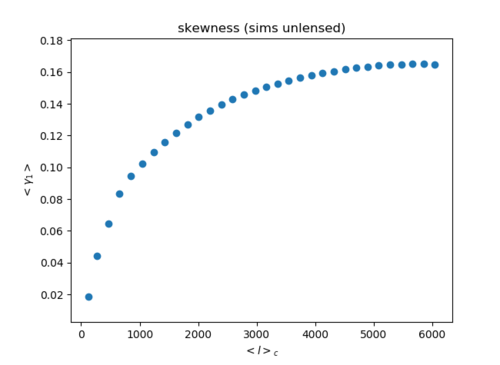
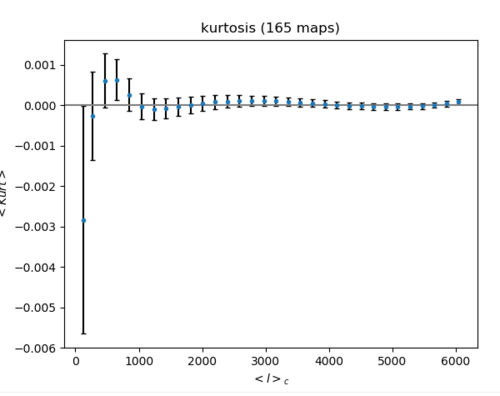
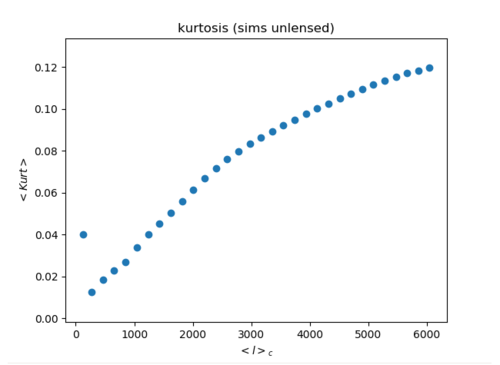
I generated 165 Gaussian maps using the same Cl's as the sims unlensed map, ran them through the band filters to get a plot of the mean skewness & kurtosis by l-band and the error bars. The Gaussian maps were generated using hp.synfast(), while the error bars are simply the standard deviation of the 165 skewness/kurtosis values by band.
1. Skewness (Left: Gaussian, Right: Sims unlensed)
Except for the very first band, where the Gaussian maps' skewness possesses a high uncertainty, the sims map's skewness values are well outside the uncertainties for the Gaussian case.
2. Kurtosis (Left: Gaussian, Right: Sims unlensed)
The sims map kurtosis values are all outside the uncertainties for the Gaussian case.
From these plots, it is evident that the sims-CIB map displays non-Gaussian higher order statistics, and this can be detected by band filtering.
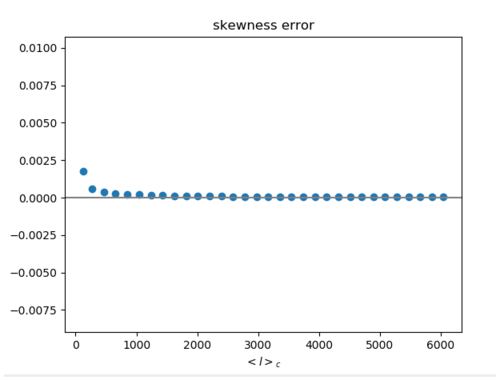
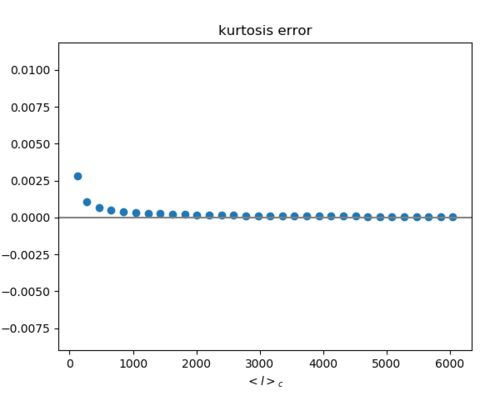
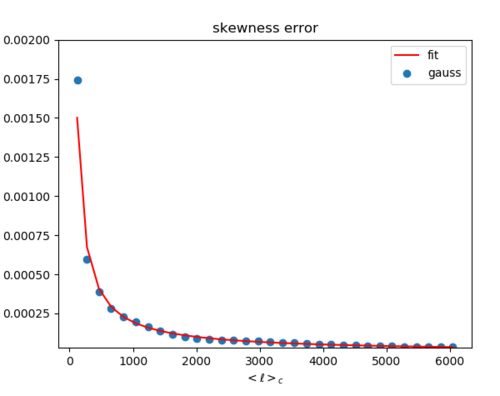
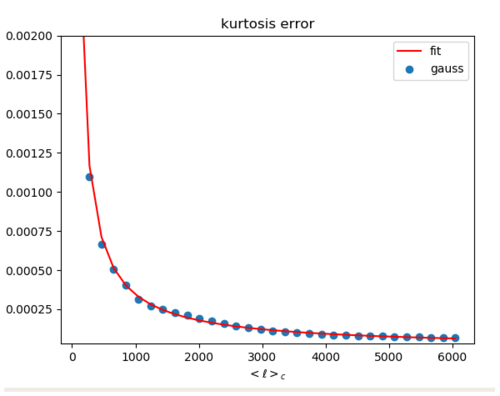
3. Error bars against ell (Left: Skewness, Right: Kurtosis)
The errors seem to be inversely proportional to ell for both skewness and kurtosis. The error is larger at low ell for kurtosis.
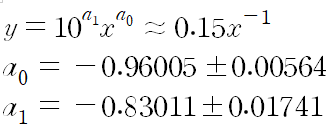
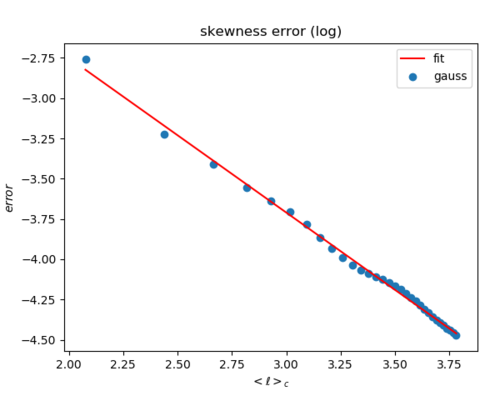
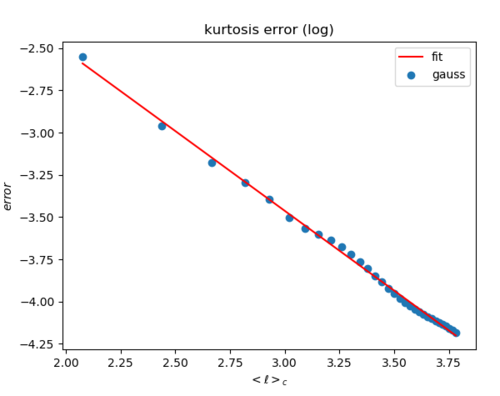
4. Fitting skewness and kurtosis errors with exponential functions.
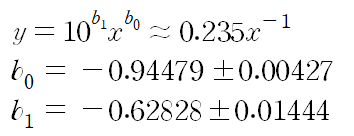
Skewness: The fitted equation and errors are as below:
Kurtosis:
The error sizes are approximately proportional to the inverse of ell as expected.
