Jan 6, 2019 - Basic statistics of the CIB - non-Gaussianity?
Before doing the filtering by bands, I took a look at some of the basic statistics of our corrected CIB maps (with chi starting from 100Mpcs rather than 0) compared to the old ones (starting from 0), along with what 'healpy.smoothing()' does. I only considered the total unlensed and lensed CIB maps for the analysis here.
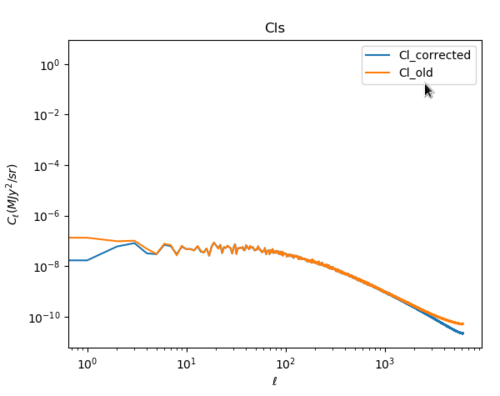
First, let's take a look at the total Cl spectra for the old and the corrected maps.
This looks plausible as the old map had an increasingly larger contribution towards the power spectrum at l > 1000.
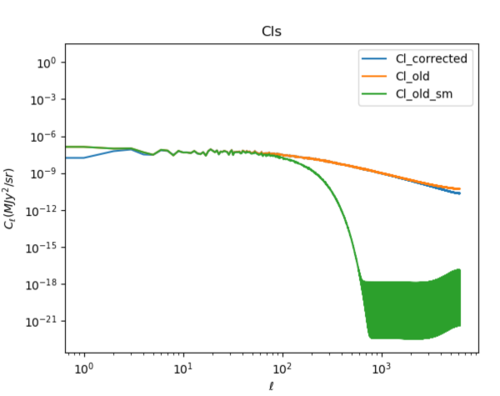
Taking a look at what smoothing does to the power spectrum, (code: hp.smoothing(map, fwhm = np.radians(1.0)))
The smoothing (done at 1 deg fwhm) acts as a low-pass filter for the power spectra, cutting off the spectra at around l ~ 100. (I smoothed the old map instead of the corrected one first because the corrected map seems very close to Gaussian as described below.)
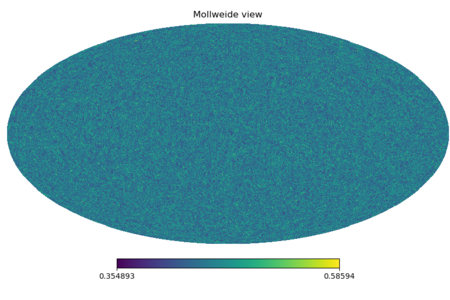
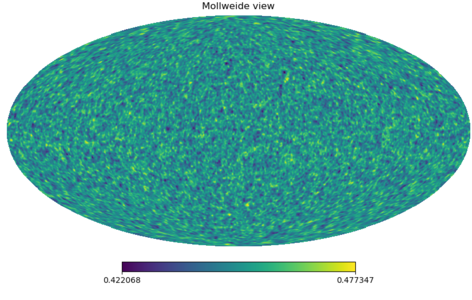
Down below is the effect of smoothing on the unlensed corrected map (original on the left, smoothed on the right).
Although the scales are not synchronized, a smearing effect obviously can be seen.
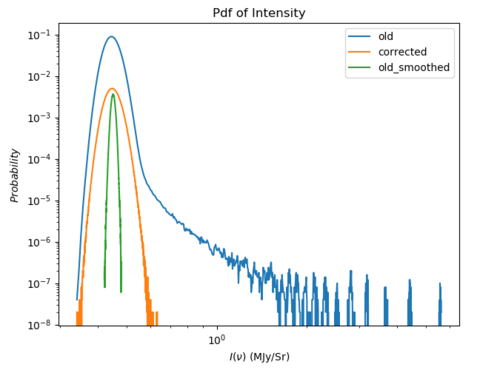
However, I found something puzzling when I plotted the histograms (of the intensity values of all the pixels).
While the widths of the corrected and old_smoothed maps' histograms are different, they both seem quite Gaussian. This is expected for the smoothed map, but why does the corrected map display such a Gaussianity? It seems that cutting out the first 100Mpcs of the map took away virtually all the non_Gaussianity as well. It could be because we are working with field maps, which may not be accurate, but we may have to think about where the non-Gaussianity comes from if it exists at all.
I am listing several statistical properties of various maps.
| Statistics | |||||
|---|---|---|---|---|---|
| unlensed corrected | lensed corrected | unlensed old | lensed old | unlensed old smoothed | |
| Mean | 0.4500151481046603 | 0.45002037126677585 | 0.4504392305757185 | 0.45044445373844866 | 0.4504392304520821 |
| Variance | 0.0005644309091081682 | 0.0005435147831908197 | 0.0006862780000182557 | 0.0006654031956708014 | 4.235820422565794e-05 |
| Skewness | 0.24568343607015708 | 0.23643962342625738 | 14.21559282426266 | 14.87652654958285 | 0.040051567962391635 |
| Kurtosis | 0.1278061760452549 | 0.11672428796362588 | 1896.0835504018182 | 2016.9322689836054 | 0.013756693086127925 |
The variance, skewness, and kurtosis for the smoothed map are quite small, and the skewness and kurtosis are extremely large for the old maps. The mean and variance are not really important here, but the skewness and kurtosis of the corrected maps seem very small as well (around 5~10 times the smoothed), which is why I am questioning their non-Gaussianity.
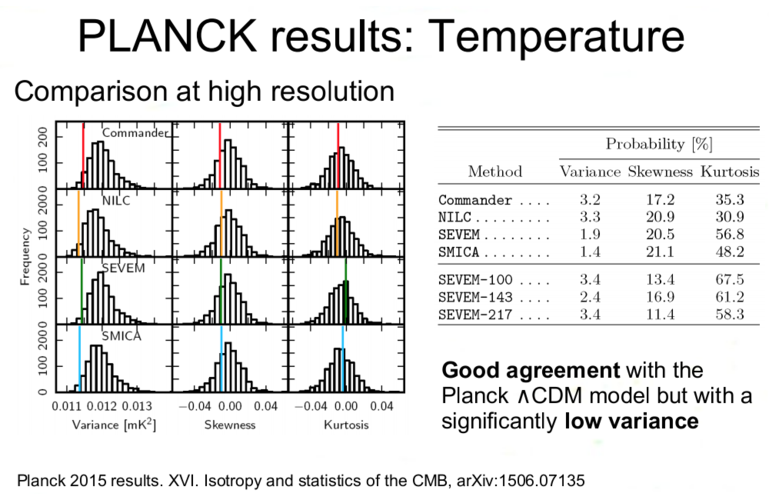
For a reference, I am attaching a slide I found in http://max.ifca.unican.es/CosmoCruise2015/Talks/Molinari.pdf, describing the variance, skewness, kurtosis of the Planck 2015 CMB data.
Of course, as the slide gives the data in "probability(%)", I simply may have to multiply 100 to the values of the table above for an accurate comparison.
