Jan 9, 2019 - Basic Gaussian filtering (revised)
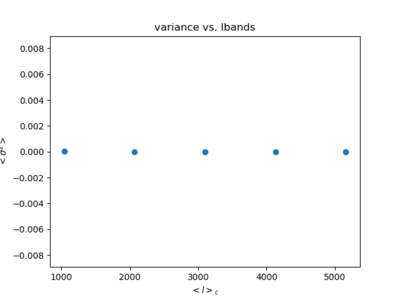
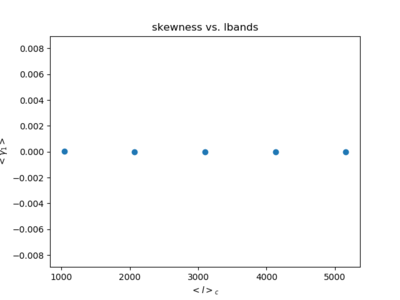
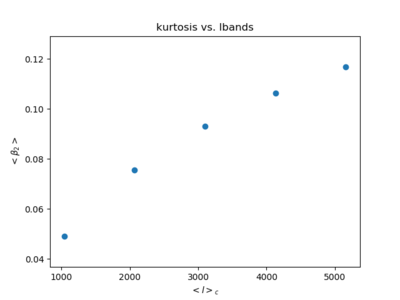
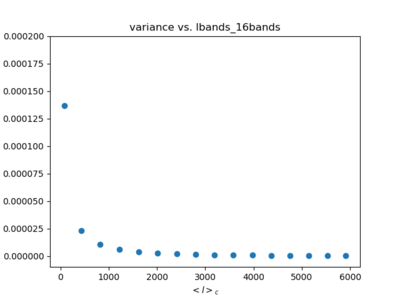
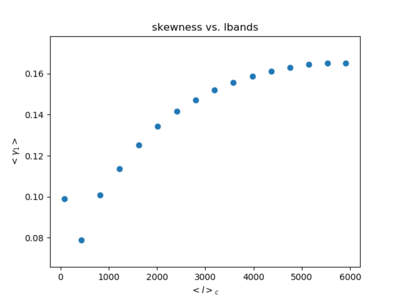
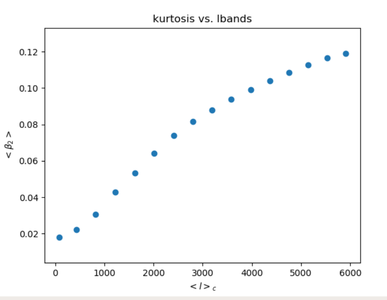
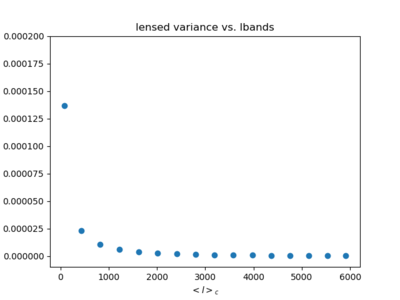
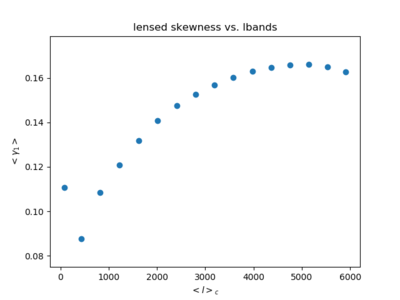
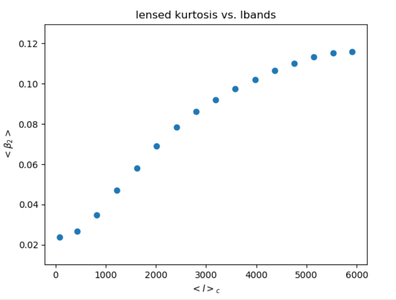
I took the statistics (variance, skewness, kurtosis) of the difference maps and plotted it against the band centres.
1. unlensed total CIB map, number of bands = 6 (fwhm of Gaussian beam defined as multiples of: 2pi/(6144/6))
There are only five points because I did not add the values for the first band centre. (They are added in the subsequent plots)
2. unlensed total CIB map, number of bands = 16 (fwhm of Gaussian beam defined as multiples of: 2pi/(6144/16))
3. lensed total CIB map, number of bands = 16 (fwhm of Gaussian beam defined as multiples of: 2pi/(6144/16))
I zoomed in a bit on the variance plot. The kurtosis seem to increase as l_centre ~ kurt^(0.5 to 1). Increasing the number of bands seems to increase precision, while the lensing affects the results enough to be seen by eye (especially for the skewness).
