July 26th, 2019 - CIB Lensing: Minimum Mass vs. (Halo) Kappa Power Spectra (Selected Shells & Multipoles, y-axis set to zero, goes up to higher mass cut)
Jump to navigation
Jump to search
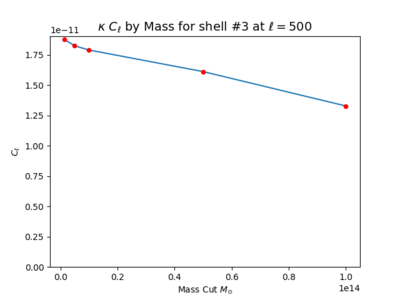
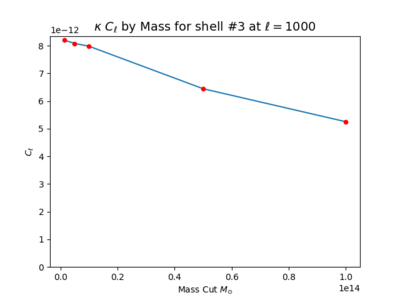
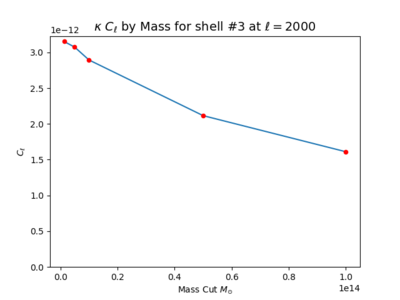
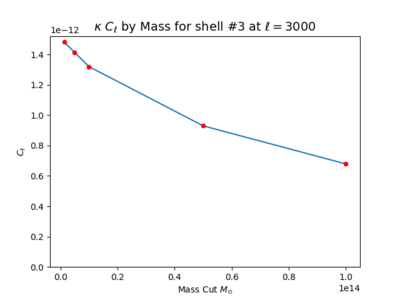
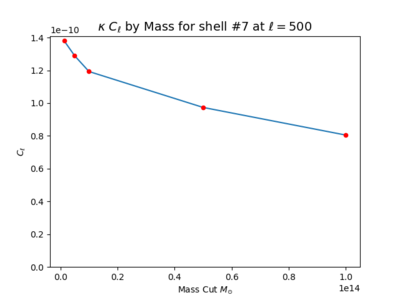
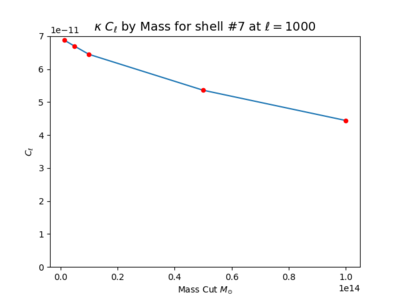
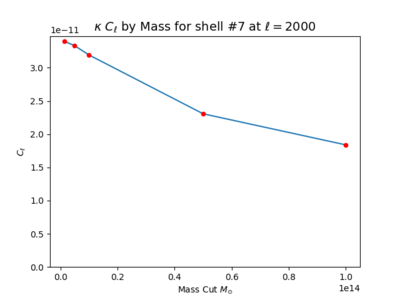
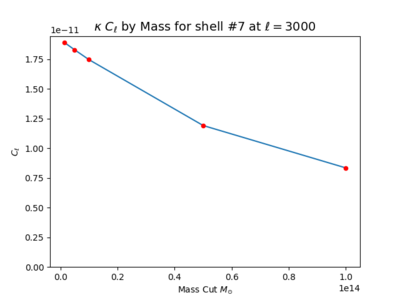
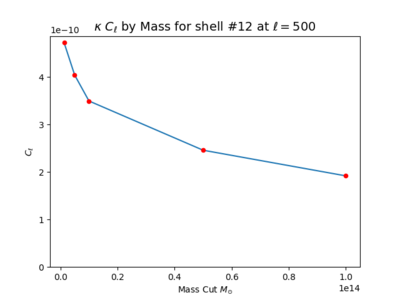
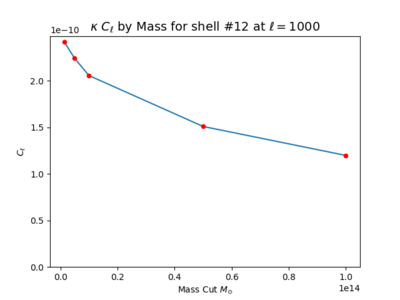
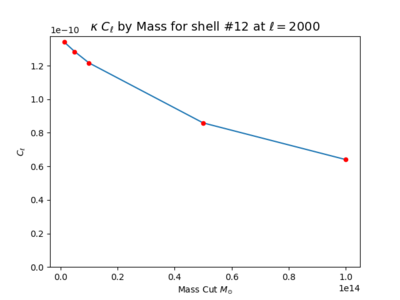
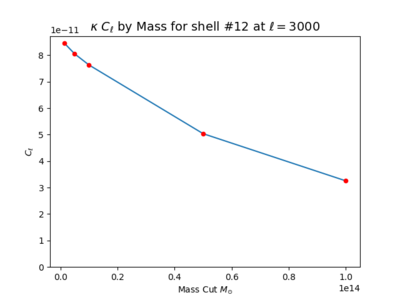
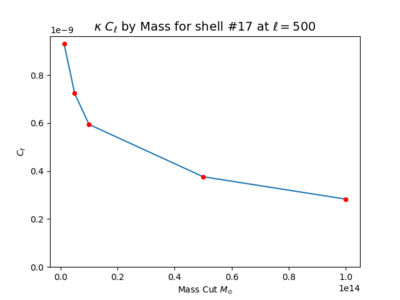
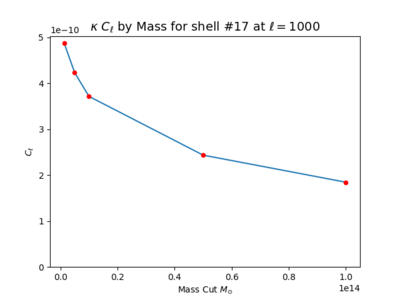
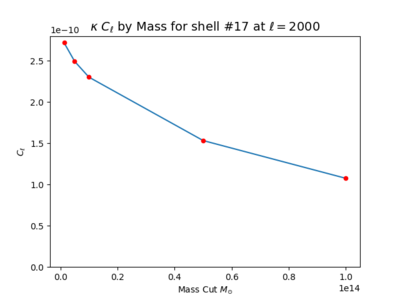
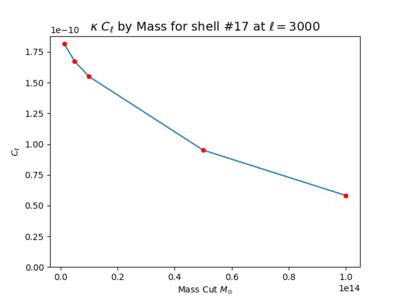
In this post, I have plots showing how [math]\displaystyle{ C_{\ell} }[/math] changes by the minimum mass (cut) for selected shells at selected multipoles. The absolute minimum mass the catalog contains is about [math]\displaystyle{ 1.29 \times 10^{12} M_{\odot} }[/math]. I have four mass cuts (5e12, 1e13, 5e13, 1e14) and the original total kappa in each of the plots. In nearly all of the plots, the power spectra start to flatten out at high mass cut, especially for shells that cover more distances.
Shell 3 (0 ~ 1200 Mpcs, Source at 1400 Mpcs) ([math]\displaystyle{ \ell = 500, 1000, 2000, 3000 }[/math])
Shell 7 (0 ~ 2800 Mpcs, Source at 3000 Mpcs) ([math]\displaystyle{ \ell = 500, 1000, 2000, 3000 }[/math])
Shell 12 (0 ~ 4800 Mpcs, Source at 5000 Mpcs) ([math]\displaystyle{ \ell = 500, 1000, 2000, 3000 }[/math])
Shell 17 (0 ~ 6800 Mpcs, Source at 7000 Mpcs) ([math]\displaystyle{ \ell = 500, 1000, 2000, 3000 }[/math])
