June 16th, 2019 - Detectability of the Reduced Bispectrum (545GHz)
I have been trying to add noise of the Planck HFI to the reduced bispectrum (545GHz) plot. Although this is turning out to be more complicated than I expected, I have a brief summary of how I have been trying to add the noise below.
Power Spectrum of the Noise
The expression for the noise power spectrum is: [math]\displaystyle{ C_{\ell}^{\text{noise}} = Q^2 \exp{[\frac{\ell(\ell+1)\theta^2}{8 \ln 2}]} }[/math],
where [math]\displaystyle{ Q = s \text{ (MJy*deg/sr)} \times \frac{\pi \text{ rad}}{180 \text{ deg}} }[/math] and [math]\displaystyle{ \theta = \theta_{\text{FWHM}} = \text{beamwidth} \text{ (arcmin)} \times \frac{1 \text{ deg}}{\text{ arcmin}} \times \frac{\pi \text{ rad}}{180 \text{ deg}} }[/math]
with the temperature sensitivity [math]\displaystyle{ s }[/math] for 545GHz provided by [Planck 2015 results. VIII. High Frequency Instrument data processing: Calibration and maps (https://www.aanda.org/articles/aa/pdf/2016/10/aa25820-15.pdf)] as 0.78 kJy*deg/sr and the beamwidth as 4.83 arcmin. ([math]\displaystyle{ Q^2 }[/math] has the unit [[math]\displaystyle{ \text{MJy}^2/\text{sr} }[/math]] .)
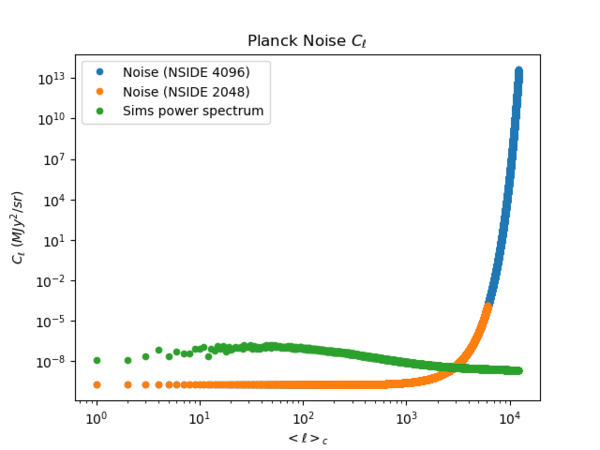
The power spectrum of the noise and the CIB (sims) are given below.
For the NSIDE 2048 map, the [math]\displaystyle{ \ell_{\text{max}} }[/math] is approximately 6000, while for the NSIDE 4096 map, the [math]\displaystyle{ \ell_{\text{max}} }[/math] is approximately 12000. The noise starts to dominate at [math]\displaystyle{ \ell \approx 3000 }[/math]. While the noise ([math]\displaystyle{ 10^{-3} }[/math]) at [math]\displaystyle{ \ell \approx 6000 }[/math] is about 6 orders of magnitudes higher than the CIB ([math]\displaystyle{ 10^{-9} }[/math]), by [math]\displaystyle{ \ell \approx 12000 }[/math], the noise ([math]\displaystyle{ 10^{13} }[/math]) becomes more than 20 orders of magnitudes higher.
Power spectrum of the map + noise
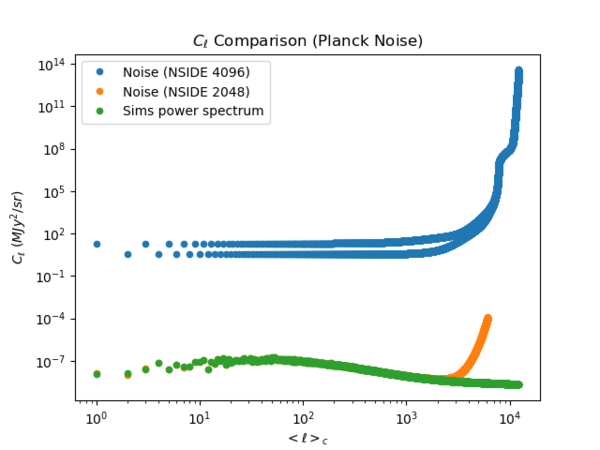
After generating noise maps with the corresponding power spectra for NSIDE 2048 and 4096, I added each of them with the sims CIB map. However, taking a look at the power spectra of the noise+CIB maps,
we can see that the noise added map for NSIDE 4096 shows a power spectrum that does not make sense (seems to have blown up). Thus, I added the noise up to only [math]\displaystyle{ \ell = 6000 }[/math] for the subsequent analyses.
Bispectrum of the map + noise
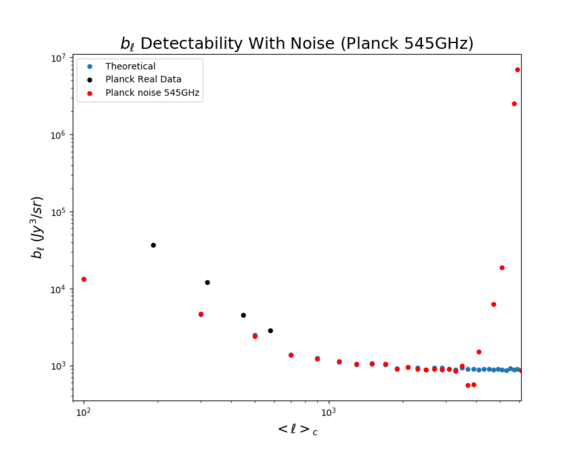
Using the numerical approximations of the reduced bispectrum as in previous posts (3rd moment = some constant * reduced bispectrum), I was able to obtain the plot below for the noise added bispectrum.
From [math]\displaystyle{ \ell = 3500 }[/math], there is a discrepancy between the simulation data and the noise added data. However, the behaviour of the noise added values seem a bit odd; the first few that deviate significantly (by more than half an order of magnitude) falls below the theoretical values and then the rest rise drastically by multiple orders of magnitudes.
Because the [math]\displaystyle{ b_{\ell} }[/math] corresponds to the 3rd moment in map space, while the [math]\displaystyle{ C_{\ell} }[/math] corresponds to the 2nd moment (variance), intuitively one would expect [math]\displaystyle{ b_{\ell} }[/math] to blow up at a high enough [math]\displaystyle{ \ell }[/math]. Although this generally seems to be true, there are some anomalies as mentioned above, and some values (that do not show up in the plot) even fall below 0 (which must be some kind of malfunction/bug in Python).
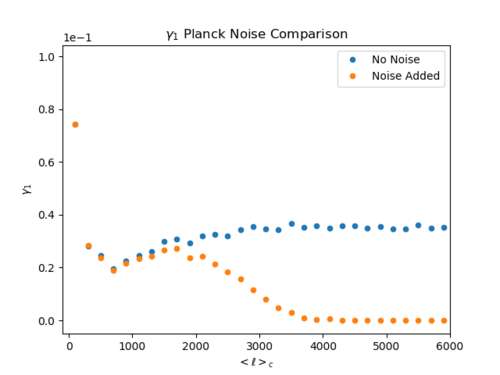
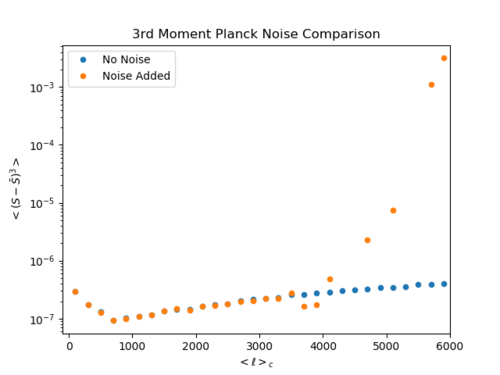
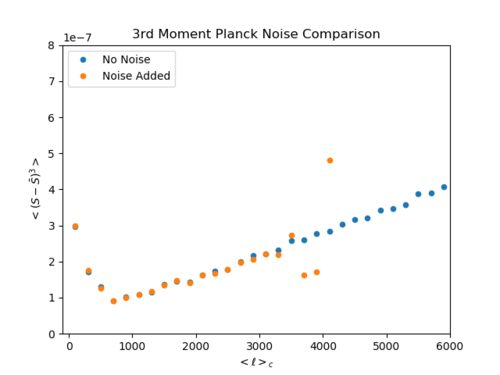
In an attempt to understand this, I plotted the noised added normalized skewness ([math]\displaystyle{ \gamma_1 = \lt (\frac{ (S -\bar{S}) }{\sigma})^3\gt }[/math]) and noise added 3rd moment ([math]\displaystyle{ S_3 = \lt (S -\bar{S})^3\gt }[/math]) below.
Normalized skewness and 3rd moment of the map + noise
(Top: normalized skewness, Bottom left: 3rd moment (log y-axis), Bottom right: 3rd moment (linear y-axis))
In the skewness plot, we see that the noise added values start to show large discrepancies at [math]\displaystyle{ \ell \approx 2000 }[/math], and fall smoothly to zero by [math]\displaystyle{ \ell = 4000 }[/math] (this is what we saw in the plots for my AST425 final report).
(I apologize for not having the units on the y-axis of the 3rd moment plot, which is [[math]\displaystyle{ \text{MJy}^3/\text{sr}^3 }[/math]].)
Looking at the bottom left plot, the noise added 3rd moment falls below the expected values at [math]\displaystyle{ \ell = 3700 }[/math], then rises above at [math]\displaystyle{ \ell = 4100 }[/math] and continues rising (except for when the noise added values fall below 0 as at [math]\displaystyle{ \ell = 4300, 4500 }[/math] etc.). On the right plot, I plotted the y-axis linearly to see if I could forecast 'from what [math]\displaystyle{ \ell }[/math] would Planck not have been able to detect the 3rd moment/bispectrum to a meaningful accuracy?' but it is a bit unclear to me where this value of [math]\displaystyle{ \ell }[/math] is. It is obvious that Planck cannot have been sensitive enough to detect [math]\displaystyle{ b_{\ell} }[/math] at [math]\displaystyle{ \ell \gt 3500 }[/math], but at smaller [math]\displaystyle{ \ell }[/math], the discrepancy fluctuates; the discrepancy does not necessarily become larger as [math]\displaystyle{ \ell }[/math] increase when [math]\displaystyle{ \ell \lt 3500 }[/math].
Another complication, is that when we look at the noise added skewness, we can confidently say that Planck would have been (semi-)accurate until [math]\displaystyle{ \ell \approx 2000 }[/math], but the noise added 3rd moment behaves differently; it actually seems more accurate at [math]\displaystyle{ \ell = 3500 }[/math] compared to the skewness at [math]\displaystyle{ \ell = 2000 }[/math].
For now, it seems safe to say that Planck would have been able to detect the equilateral component of the reduced bispectrum at 545GHz pretty accurately to [math]\displaystyle{ \ell = 2000 }[/math], but the question is what we can conclude for [math]\displaystyle{ 2000 \lt \ell 3500 }[/math].
