March 1, 2019 - Halo maps analysis
I did some preliminary analysis using the total CIB halo map George sent me. As discussed, the higher order statistics of the halo map is vastly different from the field.
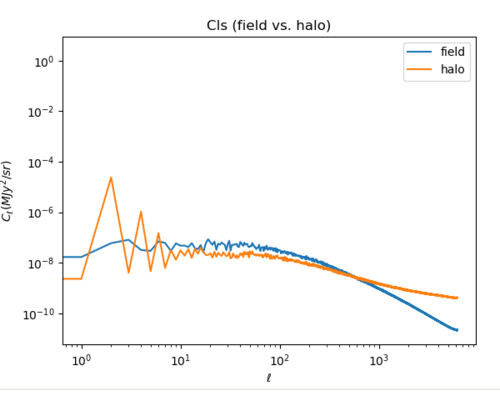
1. Power spectra (field vs. halo)
The power spectrum of the halo seems more flat compared to the field.
2. Total map statistics:
| Statistics | |||||
|---|---|---|---|---|---|
| field | halo | ||||
| Mean | 0.4500151481046603 | 0.1256358205880366 | |||
| Variance | 0.0005644309091081682 | 0.00229961971779621 | |||
| Skewness | 0.24568343607015708 | 7.889138442743544 | |||
| Kurtosis | 0.1278061760452549 | 3244.4918872011885 | |||
While the mean and variance differ by about 4~5 times, the skewness and kurtosis for the halo map are huge.
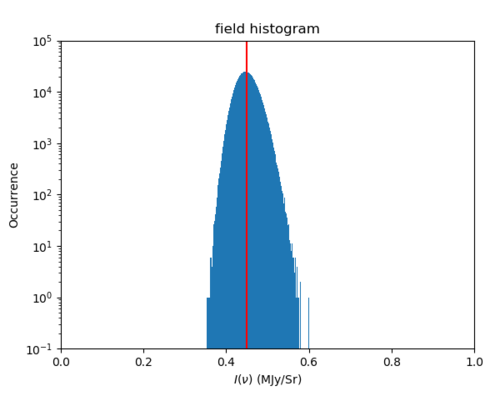
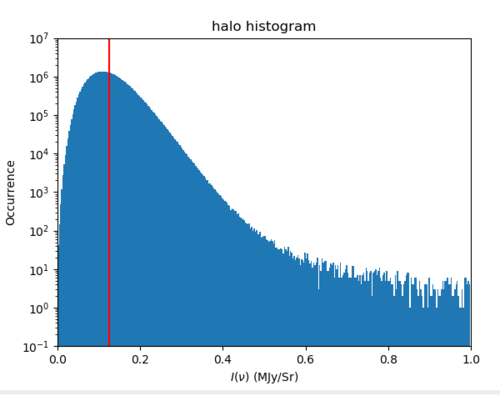
3. Histograms
As expected, the field and halo intensity distributions by pixel are vastly different. For the halo map, there is a cut-off at an intensity of 10^(-4) MJy/sr, meaning that any values smaller than this was not taken into account. I also do not quite understand why the occurrence scales are so different from each other when both the field and halo maps have 50331648 pixels (it could be because of the binning, which was defined by 10000 linear bins).
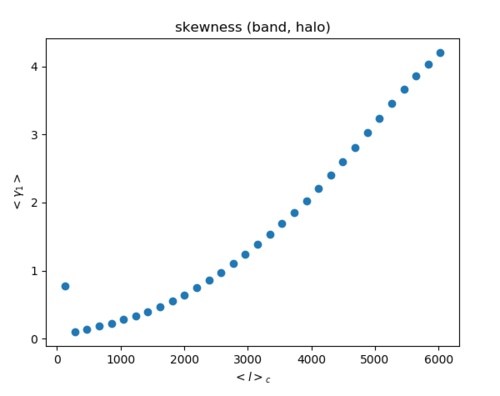
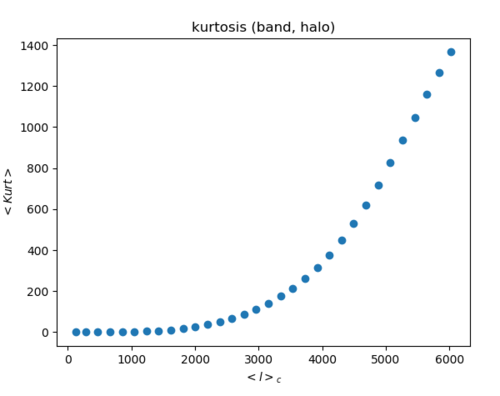
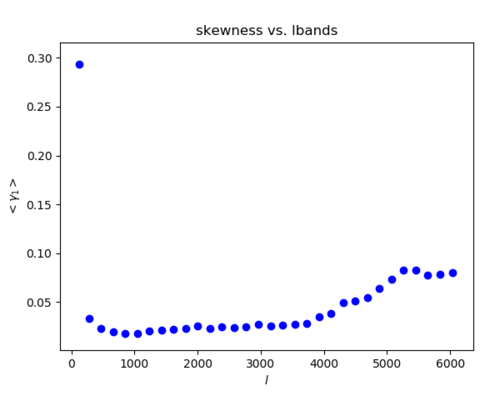
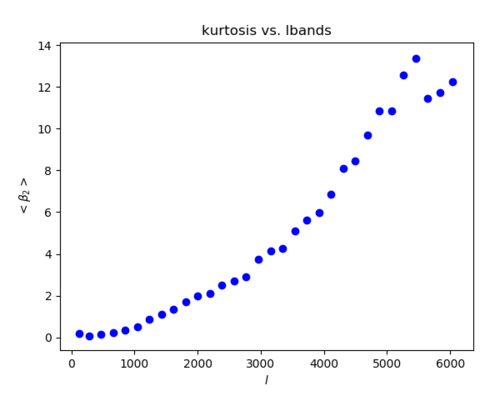
4. a) Band filtering of the halo map (Left: skewness Right: kurtosis)
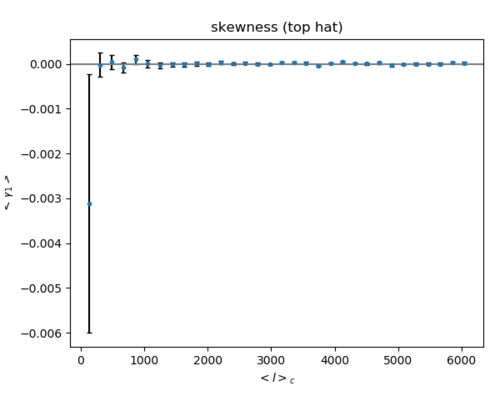
b) Top hat filtering of the halo map (Left: skewness Right: kurtosis) (200 maps)
Band: The skewness is on the order of 100 times the field, while the kurtosis is on the order of 1000~10000 times the field. At an ell>3000, the skewness does seem to follow a Poisson trend.
Top hat: Skewness and Kurtosis are both greatly reduced by the top hat filter as with the field map, but because the non-Gaussianity for the halo map is so large, some skewness and kurtosis are still present. The kurtosis follows almost the same trend as the kurtosis for band filtering above, only at a magnitude 100 times smaller. The first band in the skewness plot show large values for both the top hat and band.
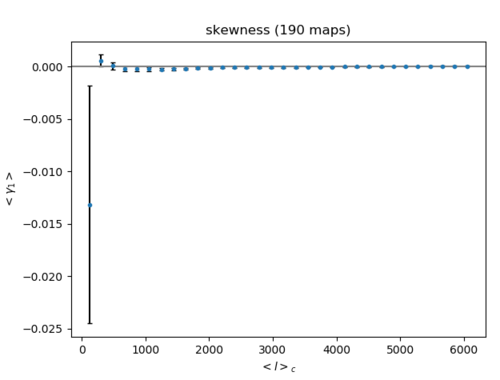
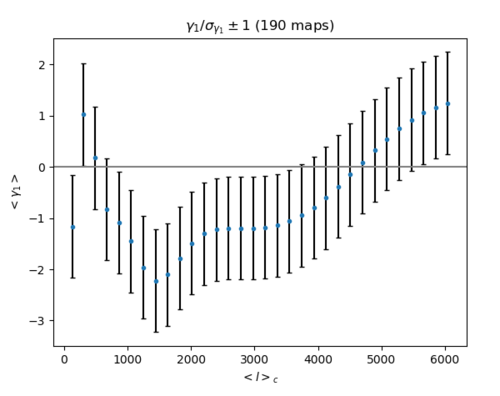
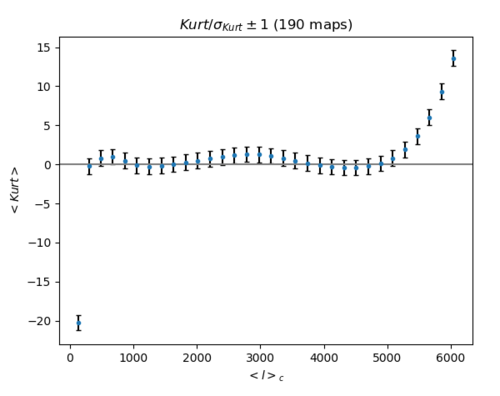
5. a) Band filtering of Gaussian maps with the same power spectra as the halo map (Left: skewness Right: kurtosis)
[math]\displaystyle{ \frac{A}{\sigma_{A}} \pm 1 }[/math] (Where A is skewness for the left plot, kurtosis for the right plot)
When the skewness and kurtosis were divided by its standard deviation, the skewness/sigma is around zero (although it doesn't seem to be randomly fluctuating around 0) while the kurtosis rises away from zero at high ell.
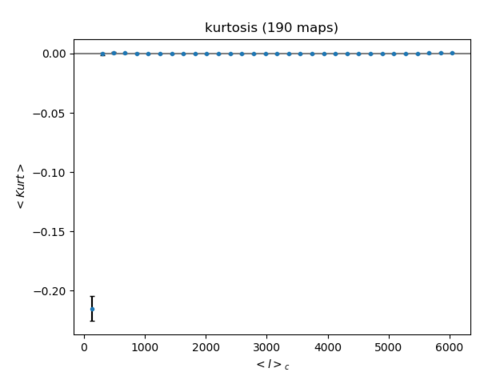
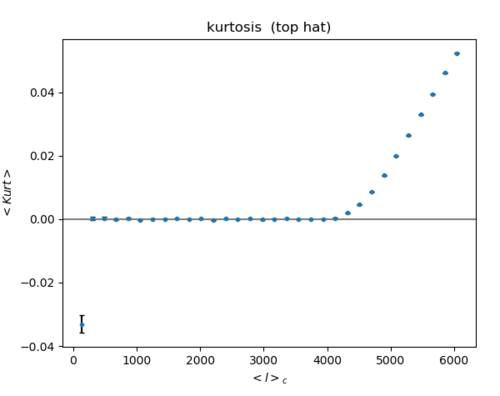
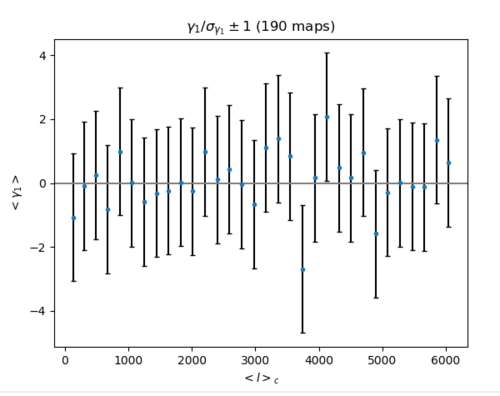
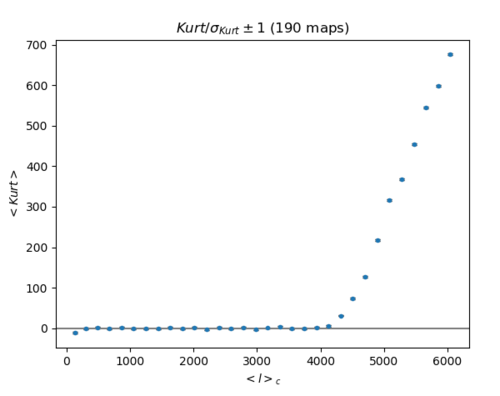
b) Top hat filtering of Gaussian maps with the same power spectra as the halo map (Left: skewness Right: kurtosis) (200 maps)
The skewness/sigma here is around zero, and it does fluctuate randomly around 0. However, the kurtosis/sigma rises significantly at an ell>4000.
[math]\displaystyle{ \frac{A}{\sigma_{A}} \pm 1 }[/math] (Where A is skewness for the left plot, kurtosis for the right plot)
Band: The skewness and kurtosis for Gaussian maps are nearly zero, and now there is a huge difference between the skewness/kurtosis of the halo-CIB and Gaussian realization.
Top hat: The skewness for Gaussian maps are around zero, but this is not the case for kurtosis. Other than the outlier for the first band, kurtosis rises linearly from ell = 4500 although the magnitude isn't high.
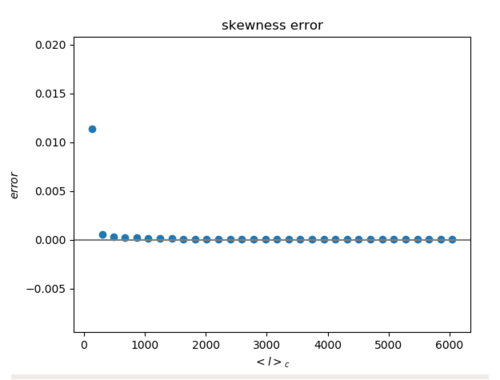
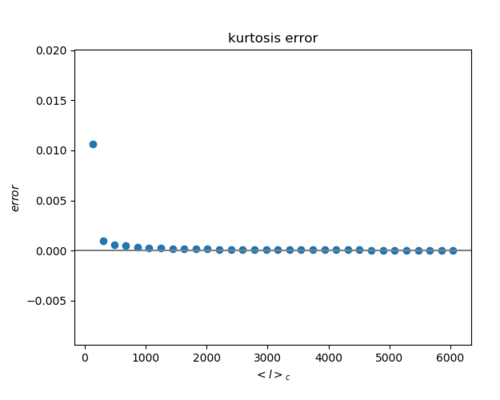
6. Error of Gaussian halo maps' band filtering (Left: skewness Right: kurtosis)
I have not fitted these yet, but they seem to follow an inversely proportional trend with ell (as before).
