May 18, 2019 - Statistics of the new CIB maps
George completely redid the CIB maps. At the moment we are still waiting for the kappa maps, so only the unlensed CIB is available.
Basic statistics
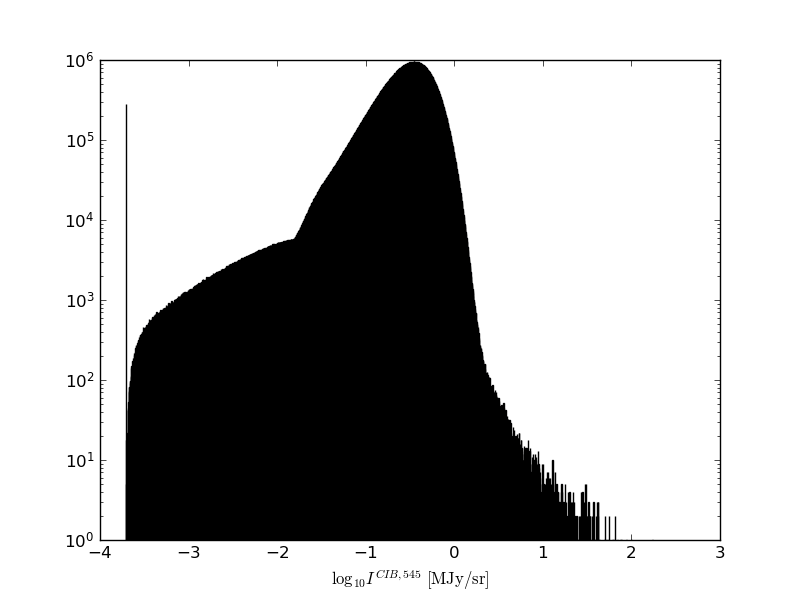
The histogram of the pixel values is below. The weird first bin at the beginning includes pixels without any signal (zeros do not play well with log).
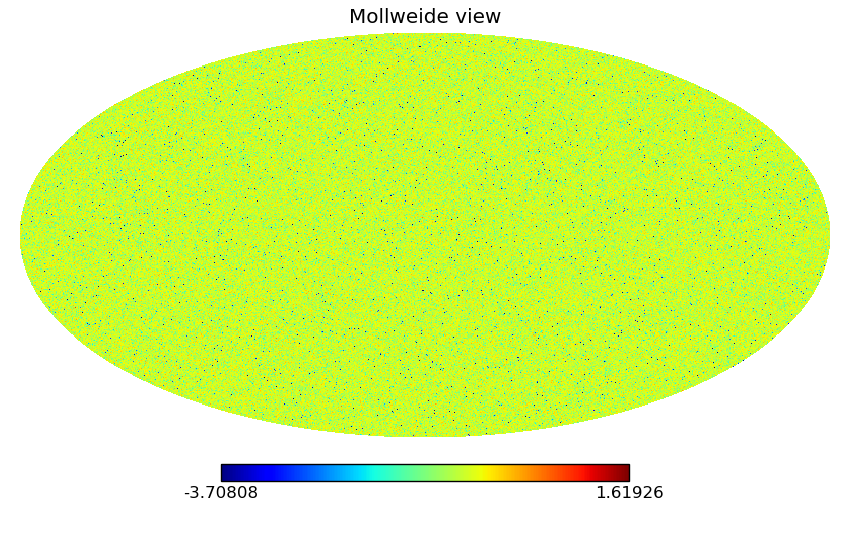
The map of the log values is presented here:
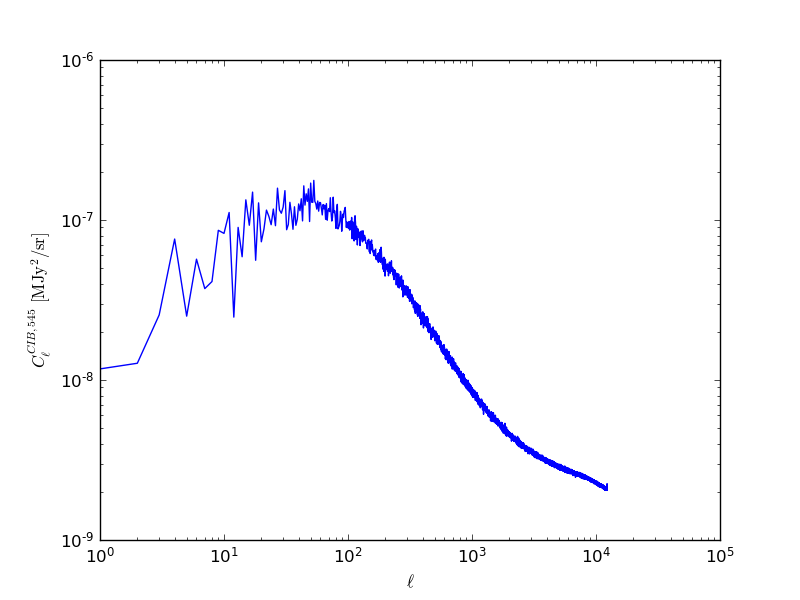
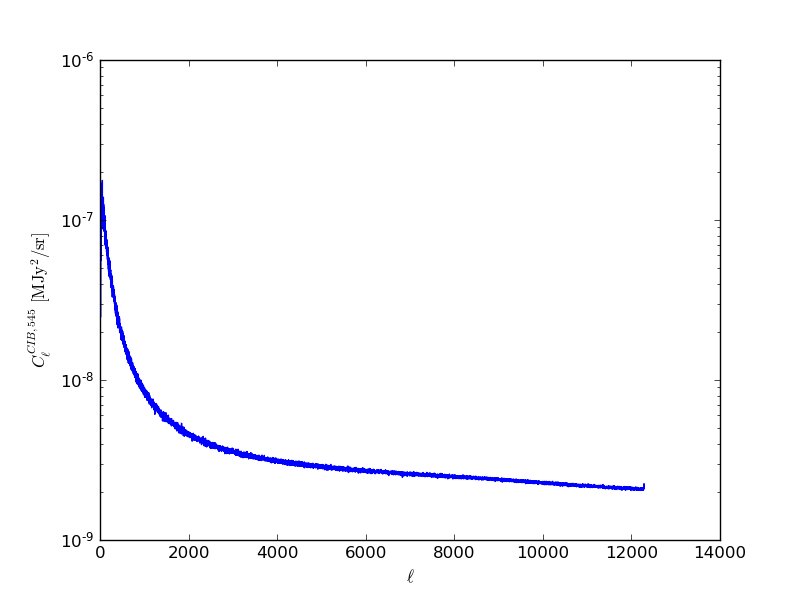
The power spectrum is here, the two figures differ in having x axis linear/log. The first one agrees with Jason, the second one allows us to gauge how well high ell can be approximated by constant [math]\displaystyle{ C_\ell }[/math].
Top hat filters
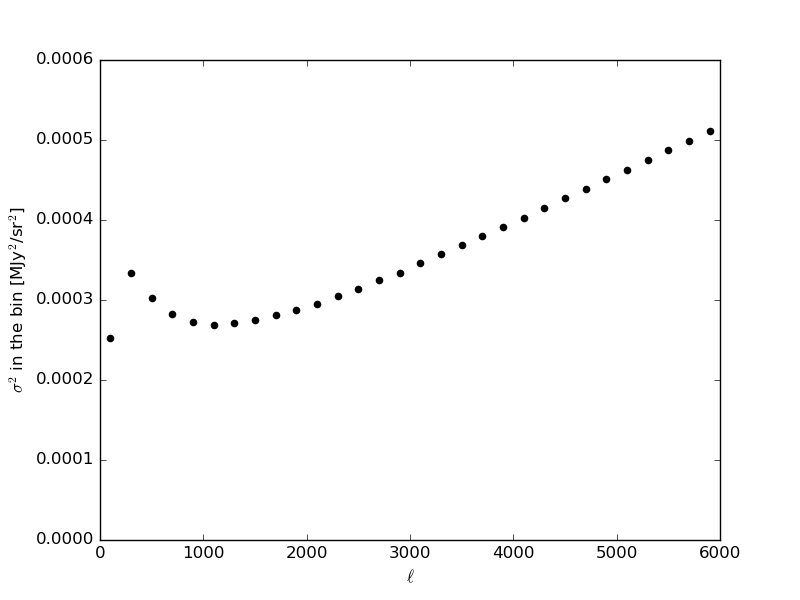
After binning everything with top hat filters with [math]\displaystyle{ \Delta \ell = 200 }[/math], we get variance
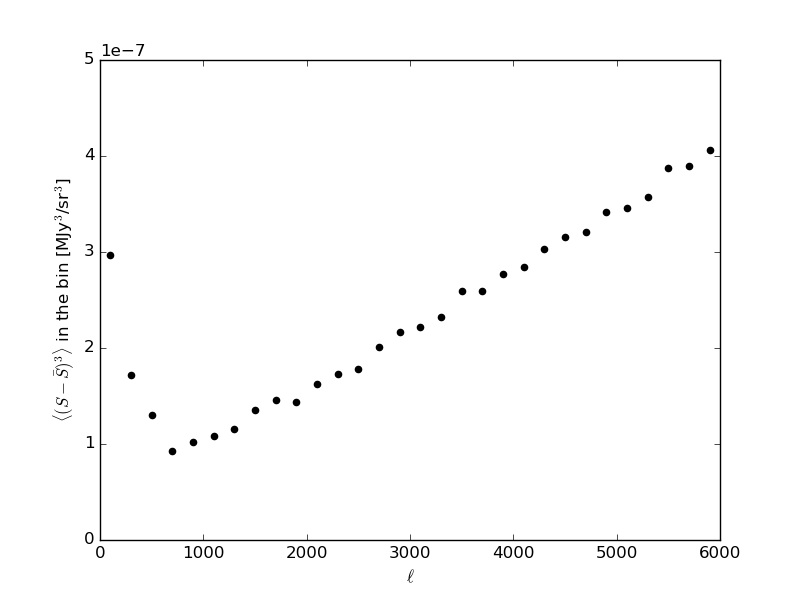
and skewness (both not-normalized and normalized by variance)
What is positive now is that the normalized skewness goes to a constant, which presumably is the Poisson limit. We compared figures with Jason and they look comparable (now he switched to [math]\displaystyle{ \Delta \ell = 400 }[/math] binning). Based on his results up to higher [math]\displaystyle{ \ell }[/math], artifacts start to creep into the results at around ell of 7000. Relatedly, some of the high ell numbers in Jason's earlier posts are affected by NSIDE effects.
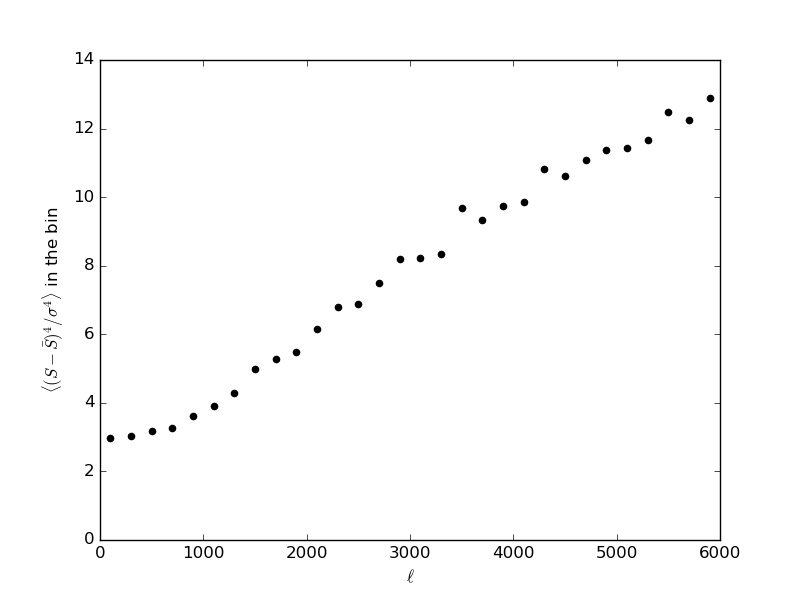
Finally, the normalized kurtosis is not quite flat, but not varying super wildly either
