May 28th, 2019 - Investigating the Discrepancy Between Poisson and Sims 3rd Moments
During our last meeting, we discussed a way to investigate the reason why the 3rd moment from the filtered sims and the theory Poisson are not matching; by generating random Poisson maps.
Before going into the details of the generated Poisson maps, I have a few plots (below) to remind ourselves where we were at before (i.e which plots were involved and by how much).
Previous Plots
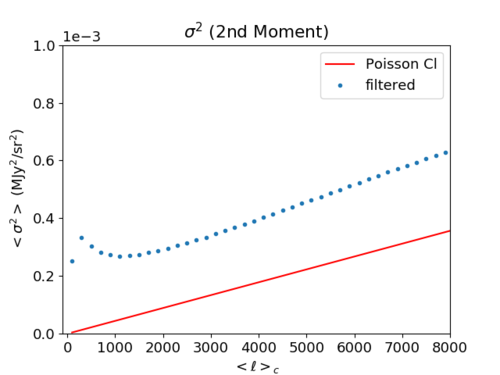
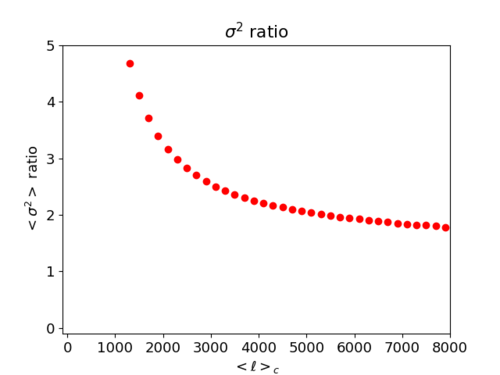
-2nd Moment
The left plot is the variance plot (2nd moment) while the right plot shows the ratio sims_values/Poisson_values; the ratio flattens out to around 2.
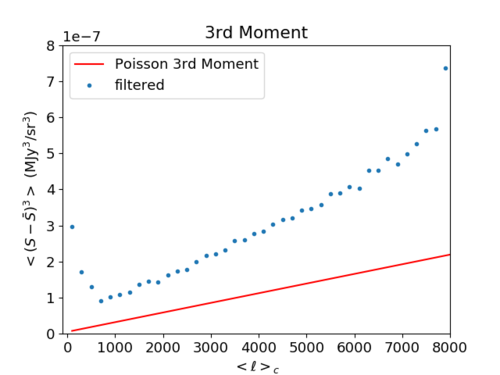
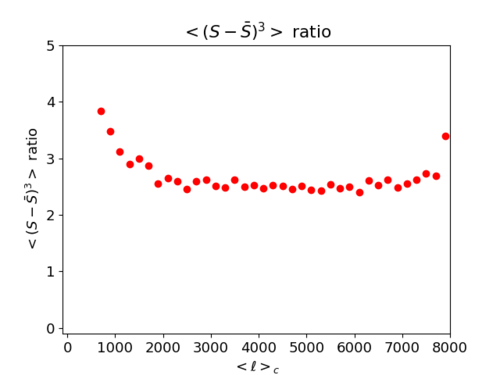
-3rd Moment
The left plot is the 3rd moment plot while the right plot shows the ratio sims_values/Poisson_values; the ratio flattens out to around 2.5.
-Reduced Bispectrum
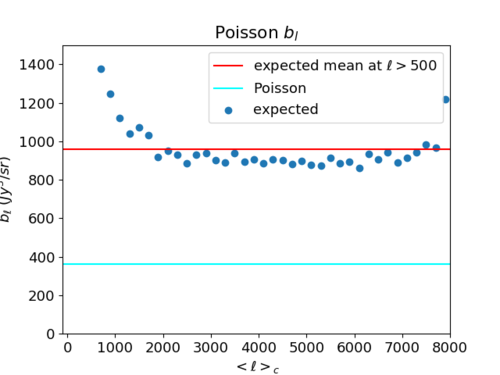
The reduced bispectrum [math]\displaystyle{ b_{\ell} }[/math] is linearly related to the 3rd moment (in the Poisson case), which is why the expected value is also around 2.5 times larger than the Poisson value.
Comparison with Generated Poisson Maps
I generated two Poisson maps:
1. By simply scrambling the pixels within the map (which I will refer to as 'pix' in subsequent plots)
2. By assigning each galaxy (or rather its flux) within the flux histogram to a random pixel in the map ('gal')
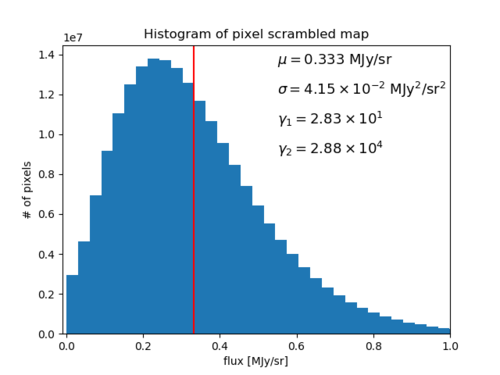
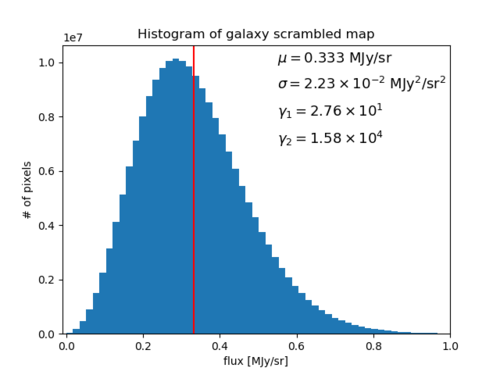
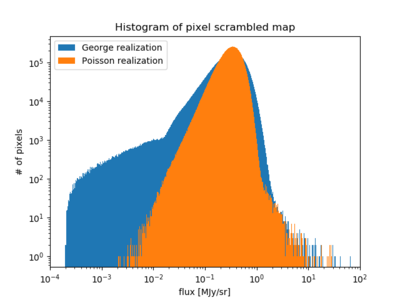
Their histograms (and basic statistics) are as below:
-Histograms
The two distributions are different; their means match the original map but their variances and (normalized) kurtosis' differ significantly. Their skewnesses are somehow close. Using the various statistical values from this distribution to check whether these two maps are Poisson does not work in a simple way (i.e. [math]\displaystyle{ \sigma^2 = \mu }[/math], [math]\displaystyle{ \gamma_1 = \mu^{-1/2} }[/math], [math]\displaystyle{ \gamma_2 = \mu^{-1} }[/math] are not satisfied as in a Poisson distribution with [math]\displaystyle{ \mu }[/math] being the mean value of a Poisson distribution) since these maps are not Poisson at the pixel scale. However, the subsequent plots should give us an idea of 'how Poisson' these maps are.
-Filtered 2nd Moment
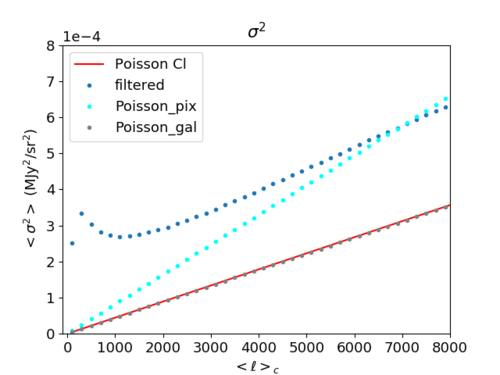
As mentioned above, Poisson_pix refers to the pixel scrambled map, while Poisson_gal refers to the galaxy scrambled map.
The result is striking, with the values for the pixel scrambled map resembling the original map at high [math]\displaystyle{ \ell }[/math] but not really matching any curve in particular, while the galaxy scrambled map almost exactly matches the theory Poisson curve.
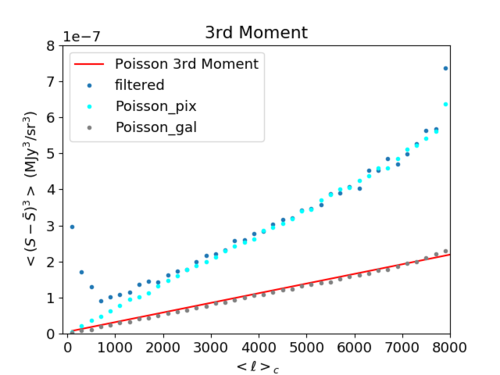
-Filtered 3rd Moment
The differences are more pronounced for the 3rd moment; the pixel scrambled map matches sims values quite well, while the galaxy scrambled map fits right on the Poisson curve.
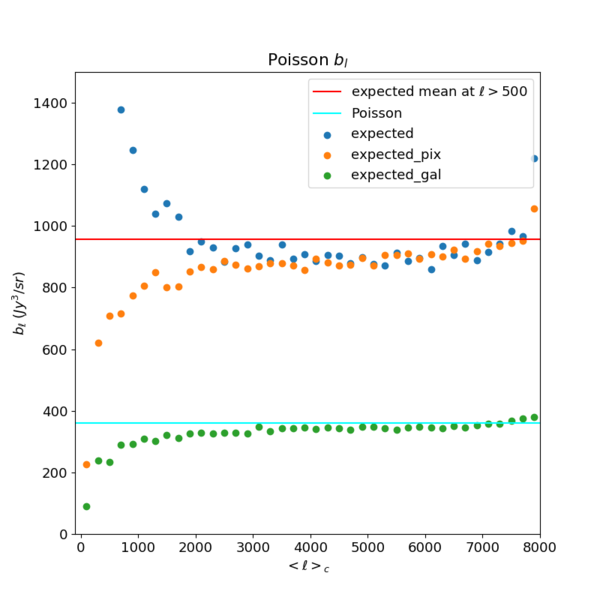
-Reduced Bispectrum Comparison
As a result, the expected reduced bispectrum (in the Poisson limit) plot also shows an even split, with the pixel scrambled and sims values matching and the galaxy scrambled and Poisson values in agreement with each other.
Conclusion
It seems that the resolution of even NSIDE 4096 maps is not enough to rule out the majority of the "observed" clustering at the pixel scale. At the galaxy level (from the catalog), the theory Poisson and the top-hat filtered statistics agree very well.
Histogram Comparisons between Galaxy Scrambled and Sims Maps
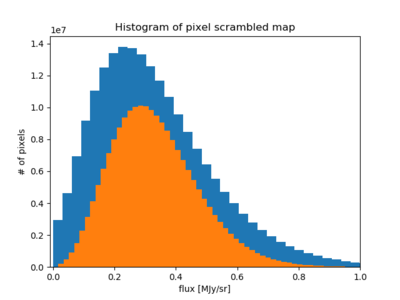
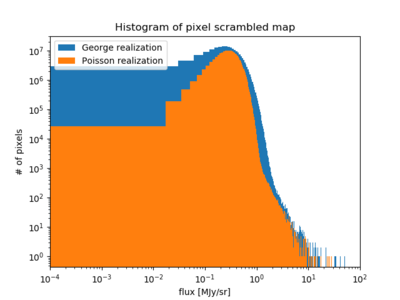
The first two plots were obtained with 10,000 linear bins with linear axes (far left) and log axes (middle). The far right histogram was plotted using 10,000 log bins.
Contrary to what the titles imply, these histograms compare the Galaxy Scrambled Map and George's sims map.
