Nov 7, 2018 - Analysis of the New Maps
Analysis of the New Maps
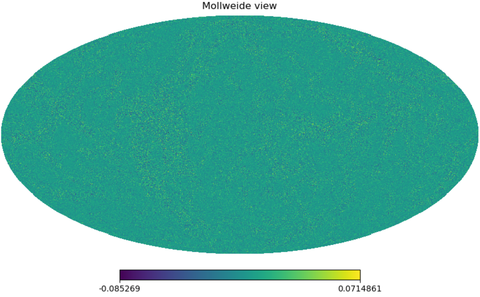
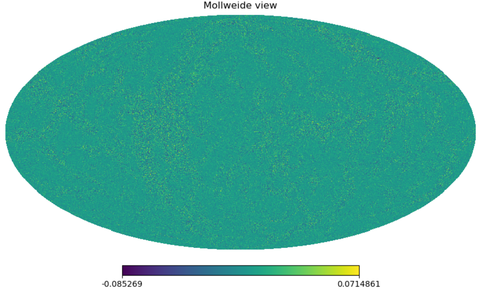
I did some basic analysis with the new (evenly-split) maps. All the plots and maps here involve the total unlensed and lensed maps and the following show comparisons with the old redshift-split maps.
1. Difference Maps
Total
- These are the total difference maps set on the same scale (MJy/sr).
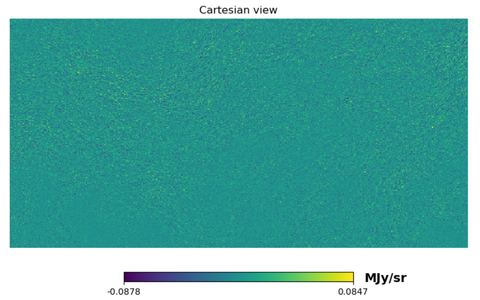
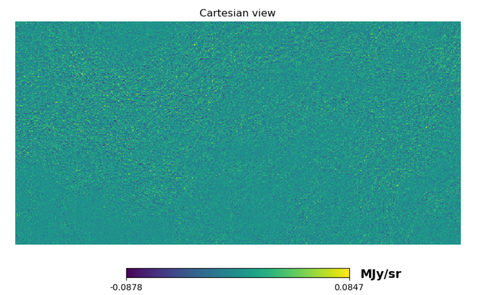
Longitude: -90º to -50º Latitude: -10º to 10º
- These two are set at the same scale as well; the new map seems to have a more pronounced difference at low longitude ranges (left portion).
2. Fractional Difference
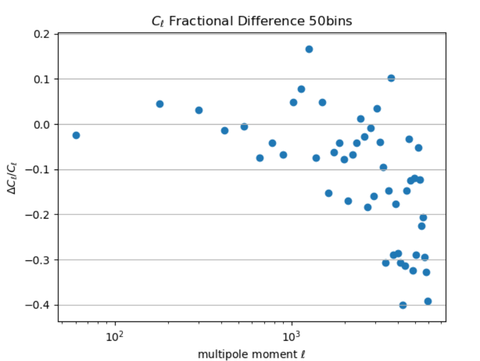
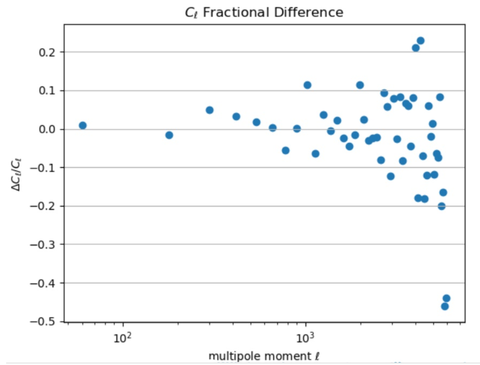
Here are the fractional difference plots with 50 bins up to an [math]\displaystyle{ l }[/math] of 6000. The binned plots were obtained using Pavel's code.
Below are the means of the fractional differences (in %, over all [math]\displaystyle{ l }[/math]).
The magnitude of the mean fractional difference decrease when evenly-split maps are used, but it still lies within the subpercent range.
3. Histograms
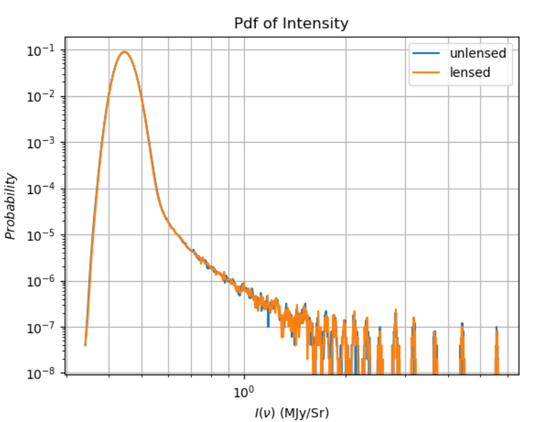
Following are some plots investigating the statistics of the lensed and unlensed maps.
Histograms of all the pixels
As before, both the unlensed and lensed CIB are weakly non-Gaussian.
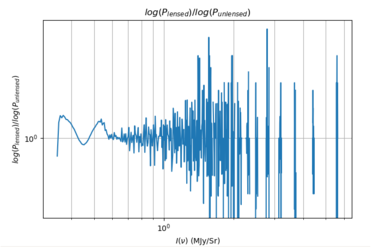
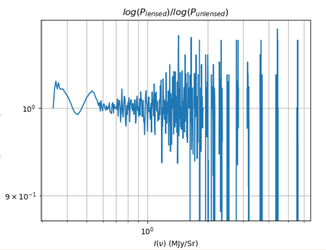
[math]\displaystyle{ log({P_{lensed}})/log({P_{unlensed}}) }[/math]
The log P plot for the evenly-split maps display somewhat larger fluctuations compared to the z-split maps.
Next Step
The accuracy of our maps are expected to increase greatly once we have the halo maps. The authenticity of our maps should be checked by 1) comparing shell by shell spectra using lenspower and lenspix 2) using Gaussian kappa field maps to generate lensed power spectra.
