Oct 10th, 2019 - Comparison with Planck at All (3) Frequencies (Reduced Bispectrum, Old Maps)
Jump to navigation
Jump to search
After getting the covariance matrices from Fabien, I calculated the error bars for 217GHz, 545GHz (which we didn't have), and compared the error bars obtained from the plot in the Planck XXX paper (https://www.aanda.org/articles/aa/pdf/2014/11/aa22093-13.pdf) using a graph-value extractor and the ones calculated from the covariance matrix.
The discrepancy I was seeing between the covariance matrix and the Planck XXX plot was largely due to my mistake (forgetting to multiply by a factor of two). However, the error bars for the lowest [math]\displaystyle{ \ell }[/math] does not seem to match, although the ones extracted from the graph are symmetrical. Below is a plot showing the difference.
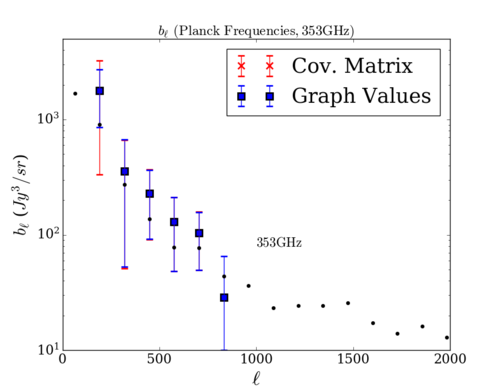

While the other four values ([math]\displaystyle{ \ell = 320, 448, 576, 704 }[/math]) match very well (There is no value given for [math]\displaystyle{ \ell = 832 }[/math] in the paper (so no covariance matrix value either), so I took it from the graph), the first one is different. For now, I am using the graph-extracted values as these errors are smaller for 353GHz. Since the graph-extracted values give a tighter constraint, I believe that using the covariance matrices for the other frequencies will at least cover any values that are potentially uncertain even for [math]\displaystyle{ \ell = 192 }[/math].
The next three plots are the comparisons (with error bars) for 545, 217GHz and a plot showing all three frequencies together.


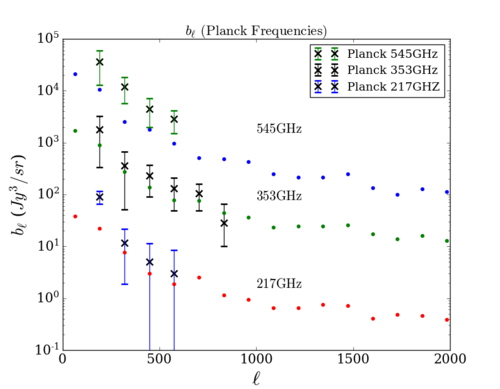

Although the 'sims' values and Planck values do not match as well for 545 and 217GHz, the new simulations should (hopefully) give values closer to Planck.