Oct 11th, 2019 - Comparison with Planck at All (3) Frequencies (Reduced Bispectrum, New Maps)
Jump to navigation
Jump to search
I am putting up an updated version of the previous post with the new maps.
Comparison of New (Left) and Old (Right) Plots


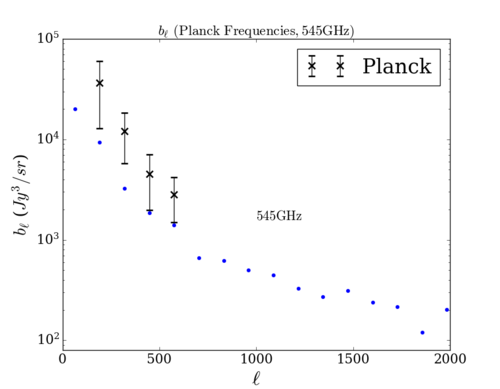
Compared to the old plot, we see that the bispectra amplitudes have generally decreased for 353GHz and 217GHz. As a result, the 'sims' values are now farther away from the Planck data points, but they are still mostly within the error bars for 353GHz and 217GHz. For 545GHz however, it seems that the bispectrum amplitudes have somewhat increased; this causes some values ([math]\displaystyle{  \ell = 320, 576  }[/math]) to move closer to Planck data points (still a bit outside of the error bars though).

Below are the (new) plots for each of the frequencies (in the order of 217GHz, 353GHz, 545GHz). We will be using the more conservative error bars for 353GHz (calculated using the covariance matrix).