Apr 19th, 2020 - CIB Lensing: Histograms & Negative Pixels
Jump to navigation
Jump to search
In the previous post (https://mocks.cita.utoronto.ca/index.php/Apr_19th,_2020_-_CIB_Lensing:_Maps_%26_Statistics), I mentioned that 'lenspix' turns a fraction of the originally 0 or above pixels negative (about 1 ~ 2% of the total number of pixels in a NSIDE 4096 map). I first show what the distribution of flux values look like (histograms). As it is impossible to have negative flux values in reality, I set all the negative values to 0 in the lensed maps, then calculated the difference as well as the effect of lensing on the 2, 3, 4-point functions in this case.
Histograms


The histogram of the lensed by total [math]\displaystyle{ \kappa }[/math] map seem to resemble the field-lensed map very closely. (Of course, the halo-kappa isn't the full halo version, there's a correction so that the field + halo is actually the total [math]\displaystyle{ \kappa }[/math].)
Change of n-point statistics when negative pixels are set to zero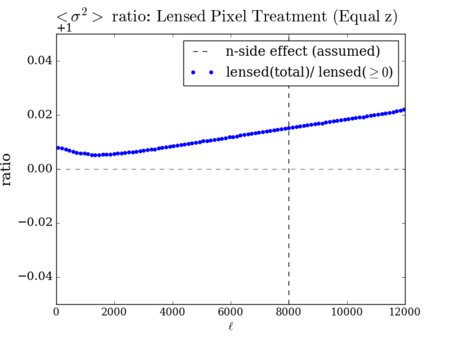
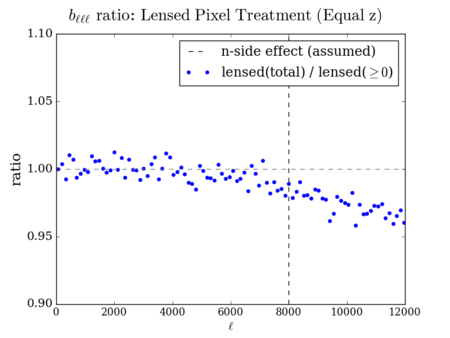
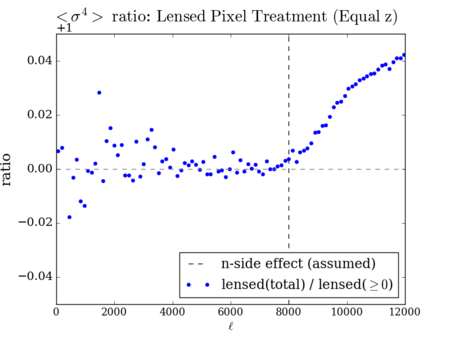


The negative pixels do have an effect on the n-point statistics, but there does not seem to be any similarities between the 2, 3, and 4 points.
Unlensed vs. Lensed (no negative pixels)


My hope was that setting negative pixels to 0 would make the effect of lensing on various n-point functions more plausible; there isn't much difference on the 3-point and 4-point at [math]\displaystyle{  \ell \lt  8000  }[/math], before where the n-side effect should kick in.
The variance vs. [math]\displaystyle{  \ell  }[/math] plot does not look plausible at all if we think the mean change in [math]\displaystyle{  C_{\ell}  }[/math] by lensing should be zero.
So for now, I will keep the negative pixels until I have better understanding of this.

 N-side effect?


In the 3-point and 4-point plots above, there's a definite change as [math]\displaystyle{ \ell }[/math] goes over 8000 (or 2/3 of the [math]\displaystyle{ \ell_{max} }[/math]), and this effect seems to mess up the 3-point in particular, quite drastically. In the next post, I will be discussing this effect (as well as the [math]\displaystyle{ C_{\ell} }[/math] conservation law).